

What you need
- The latest 10-K and 10-Q from SEC EDGAR, including the notes on investment securities, loans and the allowance for credit losses.
- The holding company's FR Y-9C from the Federal Reserve, if it has $3 billion or more in assets, and the subsidiary bank's Call Report from the FFIEC Central Data Repository or FDIC BankFind.
- The FDIC Quarterly Banking Profile, for industry figures on margins, loan losses and noncurrent loans to compare against.
- A cost of equity estimate. A round figure such as 10% to 12% is enough for a first pass.
- A spreadsheet and a screener. Our comparison of stock research tools for individual investors covers the options.
Step 1: Pull the filings and the regulatory reports
Use the holding company's 10-Q or 10-K as the primary source. A 10-Q is due 40 days after quarter end for large accelerated and accelerated filers and 45 days for all other registrants. The guide to reading a 10-Q for special situations shows where the balance sheet and notes sit.
The regulatory reports add detail the SEC filings often summarize: loan categories, past-due buckets and capital schedules in a standard format. Because every insured bank files the same Call Report, they also make peer comparison straightforward.
Step 2: Calculate tangible common equity per share
Strip out what common shareholders do not own and what cannot be sold apart from the bank:
Tangible common equity = total equity minus preferred stock minus goodwill minus other intangible assets
Divide by diluted shares outstanding. Goodwill from past acquisitions is often a large share of a bank's book value, which is why the market prices banks on tangible book. Our explainers on tangible book value and goodwill and impairments cover the mechanics.
Step 3: Mark the securities portfolio
Banks hold bonds in two accounting buckets. Available-for-sale securities are carried at fair value, with unrealized gains and losses running through accumulated other comprehensive income (AOCI), so they already sit in book value. Held-to-maturity securities are carried at amortized cost, so their unrealized losses do not appear in book value at all.
Find the fair value of held-to-maturity securities in the investment securities note, subtract the carrying value, and tax-effect the difference. Subtract it from tangible common equity to get an adjusted figure. The loss reverses as the bonds mature, so it matters most for a bank that may have to sell them early to meet deposit outflows.
Step 4: Test credit quality and reserves
Loans are the largest asset and the largest source of error. Record these from the loan and allowance notes:
- Nonperforming assets: nonaccrual loans plus foreclosed real estate, as a share of loans plus foreclosed assets.
- Net charge-offs as a share of average loans, for each of the last several years.
- The allowance for credit losses as a share of loans and as a share of nonperforming loans.
- Concentrations: commercial real estate, construction and any single industry, relative to capital.
Under the current expected credit loss standard (CECL), the allowance reflects losses expected over the life of the loans, not just losses already incurred. Compare the bank's ratios with peers and with the Quarterly Banking Profile. A reserve well below peers while the loan book is concentrated in a weak sector is a reason to cut tangible book in your downside case.
Step 5: Check regulatory capital
Capital decides whether a bank can grow, pay dividends and buy back stock, or must raise equity. The prompt corrective action rules set these thresholds:
| Capital category | CET1 ratio | Tier 1 ratio | Total capital ratio | Leverage ratio |
|---|---|---|---|---|
| Well capitalized | 6.5% or more | 8% or more | 10% or more | 5% or more |
| Adequately capitalized | 4.5% or more | 6% or more | 8% or more | 4% or more |
| Significantly undercapitalized | Below 3% | Below 4% | Below 6% | Below 3% |
Most listed banks run well above the well-capitalized line, because supervisors and markets expect a buffer. Note the gap between the reported CET1 ratio and the level management targets. Excess capital is a source of buybacks or acquisition capacity. A shortfall means dilution or a lower payout, and either should come out of your per-share value.
Step 6: Estimate sustainable ROTCE
ROTCE is net income available to common shareholders divided by average tangible common equity. Many analysts add back after-tax amortization of intangibles to the numerator.
Do not use the last quarter alone. Rebuild a normal year:
- Net interest income: average earning assets times a net interest margin you can defend across a rate cycle.
- Fee income, excluding one-time gains on securities or branch sales.
- Operating expenses, using the efficiency ratio (expenses divided by revenue) as a check against peers.
- Provision for credit losses at a through-the-cycle net charge-off rate, not the current low or high.
- Taxes at the normal rate.
Divide the result by adjusted tangible common equity from Step 3. This is the most important input in the valuation, so build a base, a downside and an upside figure.
Step 7: Set the justified price-to-tangible-book multiple
A bank that earns exactly its cost of equity should trade at tangible book. One that earns more should trade above it, and one that earns less below it. The justified multiple is:
Justified P/TBV = (ROTCE minus g) divided by (cost of equity minus g)
where g is the long-run growth rate of tangible book. The same logic sits behind the price-to-book ratio for any company, but it fits banks especially well because almost all of their assets and liabilities are financial and carried close to market value.
You can also run it backward: take the market's P/TBV and solve for the ROTCE it implies. If the implied return is well below what the bank has earned through a full cycle, the market is pricing in a decline, and your work in Steps 4 and 6 should say whether that is fair.
Step 8: Cross-check with excess return and dividend models
The excess return model values a bank as its equity plus the present value of returns above the cost of equity:
Value per share = TBV per share + (ROTCE minus cost of equity) times TBV per share, divided by (cost of equity minus g)
The dividend discount model values the stream of cash returned to shareholders. A bank that retains part of its earnings grows tangible book at roughly ROTCE times the retention rate, so payout and growth are linked:
Value per share = next year's dividend per share divided by (cost of equity minus g)
With consistent inputs the three methods give the same answer. When they diverge, one input is off, usually a growth rate the bank cannot fund from retained earnings.
Step 9: Build a range across credit scenarios
Finish with three cases rather than a single target:
- Downside: higher charge-offs reduce tangible book, ROTCE falls to or below the cost of equity, and the justified multiple drops to 1.0 times or less.
- Base: normal credit costs and the ROTCE from Step 6.
- Upside: excess capital returned through buybacks, or a sale of the bank. Bank mergers are usually priced on tangible book, so a takeover case gives a useful ceiling.
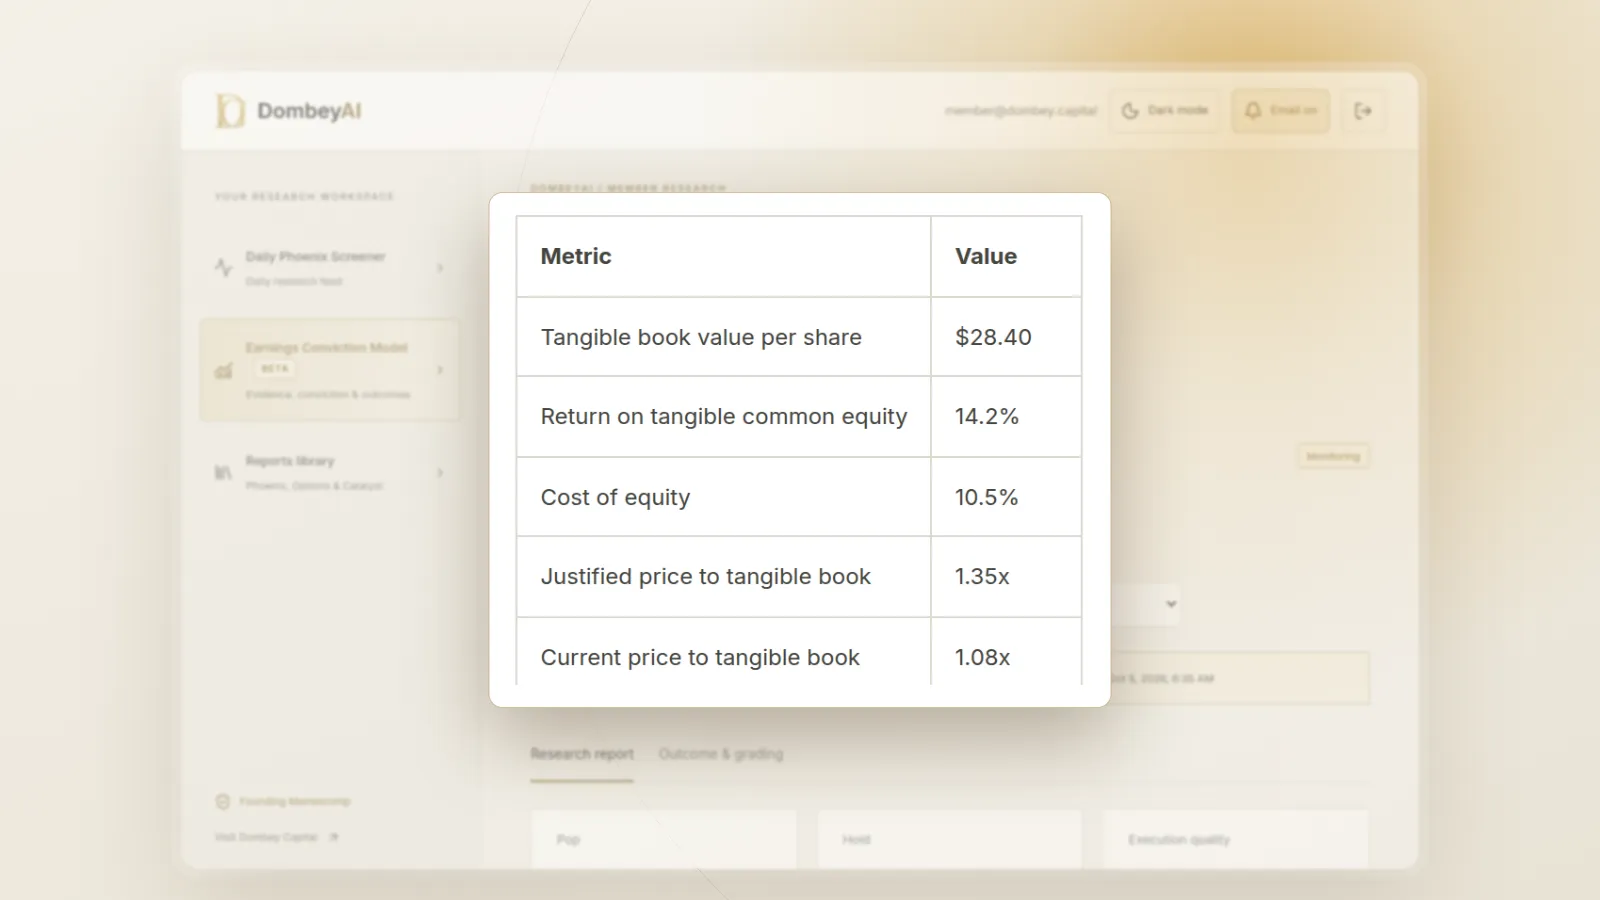
For LNSH, a downside where losses cut adjusted TBV to $27.00 and ROTCE falls to 9% gives a justified multiple of about 0.83 times, or roughly $22.50 per share. Comparing that figure with the base case of $40.00 shows how much depends on credit. Weight the cases by probability and compare the result with the price, leaving a margin of safety for errors in the inputs.
Common mistakes
- Using total book instead of tangible book. Goodwill from acquisitions inflates book value and earns nothing on its own.
- Ignoring held-to-maturity losses. They sit outside book value until bonds are sold, and deposit outflows can force a sale.
- Annualizing one quarter. A single quarter with a reserve release or a securities gain overstates normal returns.
- Trusting a low P/TBV. A bank at 0.7 times tangible book may be fairly priced if its ROTCE is below its cost of equity. That is a classic value trap.
- Assuming growth the bank cannot fund. Growth beyond what retained earnings support needs new capital, which dilutes existing holders.
Where this goes wrong
These models assume the bank stays solvent and funded. A run on uninsured deposits can force a bank to sell securities at a loss and raise capital at a deep discount within days, and no ROTCE figure captures that. Check the share of deposits that are uninsured and how much the bank can borrow against its collateral.
The models also depend on a cost of equity that is itself an estimate. Moving it by one percentage point changes the justified multiple sharply, especially when ROTCE is close to the cost of equity. Credit losses arrive in clusters, so the last few years of charge-offs can understate a normal cycle. And regulatory changes to capital rules can shift what counts as excess capital.
Dombey's published research applies this framework to banks trading below tangible book ahead of a catalyst; see the research archive.
The bottom line
A bank is worth its adjusted tangible equity plus the value of what it earns above its cost of equity. Mark the securities, test credit and capital, and only then estimate a sustainable ROTCE. Use the justified P/TBV, excess return and dividend models as checks on each other, and present the result as a range. The price tells you which ROTCE the market expects, and your job is to judge whether the bank can beat it.