

The DCF formula
The core idea is that a dollar received later is worth less than a dollar today, because money today can earn a return and because future cash is uncertain. The formula applies that idea year by year.
Value = CF1 / (1 + r)^1 + CF2 / (1 + r)^2 + ... + CFn / (1 + r)^n + TV / (1 + r)^n
- CF is the free cash flow expected in each forecast year.
- r is the discount rate.
- n is the number of forecast years, usually five to ten.
- TV is the terminal value, the value of all cash flows after year n.
The most common terminal value uses the growing perpetuity formula, often called the Gordon growth formula:
TV = CFn x (1 + g) / (r minus g)
Here g is the growth rate you expect the cash flow to sustain forever. It must be lower than r, or the formula produces a meaningless result.
The four parts of a DCF
1. Forecast free cash flow
Start with history. Cash from operations and capital expenditures are on the cash flow statement in every 10-K. Five years of history shows how margins, working capital and capital spending behave through good and bad years. Our explainer on free cash flow yield covers the adjustments that matter, such as stock-based compensation and one-off items.
Then forecast. Most analysts project revenue, an operating margin, taxes, reinvestment and the resulting free cash flow for each year. Growth usually fades toward a mature rate by the final year.
2. Choose a discount rate
The rate has to match the cash flow.
- Unlevered free cash flow (before interest) belongs to lenders and shareholders together. Discount it at the weighted average cost of capital (WACC), which blends the after-tax cost of debt and the cost of equity by their share of the capital structure. The result is enterprise value.
- Levered free cash flow (after interest) belongs to shareholders. Discount it at the cost of equity. The result is equity value.
The cost of equity is often estimated with the capital asset pricing model: a base rate, usually a long-term Treasury yield, plus beta times an equity risk premium. Each input is an estimate, and reasonable people pick different ones.
3. Estimate a terminal value
The terminal value captures everything after the forecast period. Besides the perpetuity formula, some analysts use an exit multiple, applying an EV/EBITDA multiple to the final year. Our guide to EV/EBITDA and its blind spots explains why that multiple needs care. Running both methods and comparing them is a useful check.
4. Bridge to value per share
If you discounted unlevered cash flow, you have enterprise value. Subtract debt, preferred stock and minority interest, add cash, and you have equity value. Our piece on enterprise value walks through each item in that bridge. Divide by the fully diluted share count to get value per share.
A worked example
The figures below are illustrative. Company A is hypothetical.
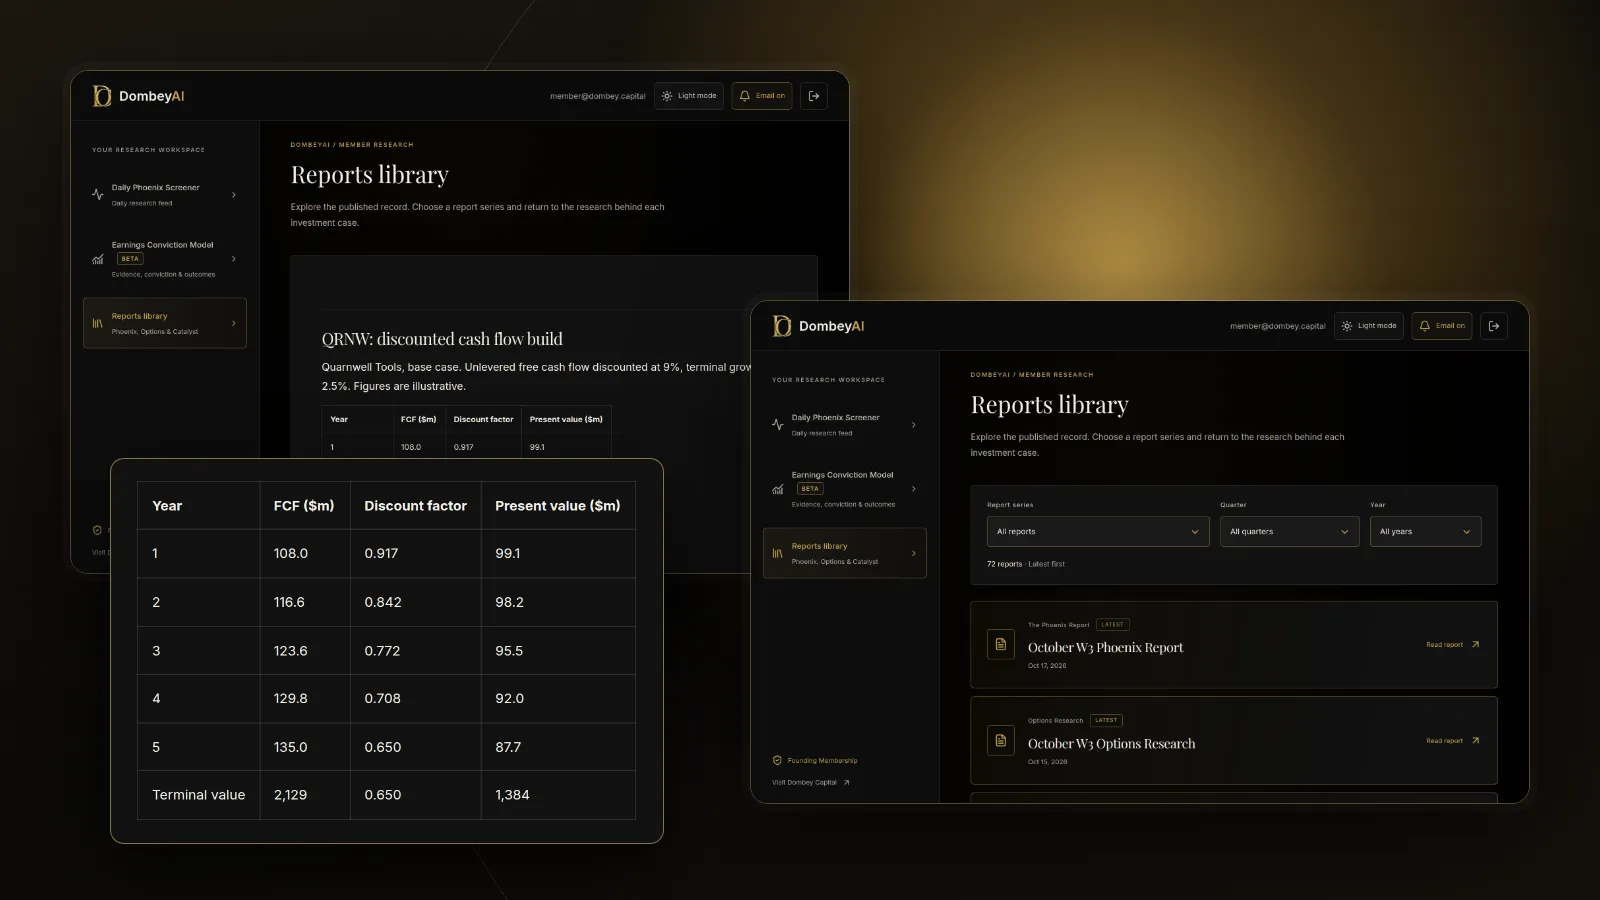
Company A produced $100 million of unlevered free cash flow last year. You expect growth of 8% in years 1 and 2, then 6%, 5% and 4%, with 2.5% a year after that. You use a discount rate of 9%. Company A has $200 million of net debt and 50 million diluted shares.
| Year | Free cash flow ($m) | Discount factor at 9% | Present value ($m) |
|---|---|---|---|
| 1 | 108.0 | 0.917 | 99.1 |
| 2 | 116.6 | 0.842 | 98.2 |
| 3 | 123.6 | 0.772 | 95.5 |
| 4 | 129.8 | 0.708 | 92.0 |
| 5 | 135.0 | 0.650 | 87.7 |
| Sum of years 1 to 5 | 472.4 |
The discount factor for each year is 1 / (1.09) raised to the year number.
Two things stand out. First, the terminal value is about 75% of enterprise value. Most of the answer comes from years you did not forecast in detail. Second, the terminal value implies about 15.8 times year 5 free cash flow. If that looks high or low against comparable businesses, revisit the inputs.
Sensitivity: why one number is not enough
Change the discount rate and terminal growth rate by small amounts and the value per share moves a lot. Same example, same cash flow forecast:
| Discount rate | Terminal growth 2.0% | Terminal growth 2.5% | Terminal growth 3.0% |
|---|---|---|---|
| 8% | $36.95 | $39.96 | $43.57 |
| 9% | $31.02 | $33.12 | $35.58 |
| 10% | $26.58 | $28.11 | $29.87 |
A one point change in the discount rate moves the answer by roughly $5 to $8 a share, about 15% to 25%. The forecast years did not change at all. This is the main reason to present a DCF as a range.
Comparing the range with the share price gives you a margin of safety. If Company A traded at $25, even the 10% and 2.0% cell sits above the price. If it traded at $38, only the generous cells support it.
DCF compared with other valuation methods
| Method | What it values | Best for | Main weakness |
|---|---|---|---|
| Discounted cash flow | Future cash flows | Stable businesses with predictable cash | Sensitive to discount and growth rates |
| Multiples (P/E, EV/EBITDA) | Price relative to peers | Quick comparisons in one industry | Inherits whatever mispricing peers carry |
| Sum-of-the-parts | Each segment separately | Conglomerates, holding companies | Needs a value for every part |
| Asset-based (book, liquidation) | What the assets would fetch | Asset-heavy or distressed firms | Ignores earning power |
| Probability-weighted scenarios | Outcomes of a specific event | Binary catalysts | Depends on probability estimates |
The methods are complements. A sum-of-the-parts valuation often uses a small DCF for one segment and a multiple for another. When a company's value hinges on a court ruling or a regulatory decision, probability-weighted valuation handles the split outcome better than a single cash flow path.
Where this goes wrong
- A terminal growth rate that is too high. A business cannot grow faster than the economy forever. Rates above about 3% in a mature-business model deserve a hard look.
- Mismatched cash flow and discount rate. Discounting levered cash flow at WACC, or unlevered cash flow at the cost of equity, gives a wrong answer with no warning sign.
- Forecasting margins nobody has achieved. If the model needs margins well above the company's own history and its best peers, write down why that will happen.
- Ignoring reinvestment. Growth costs money. A forecast that grows revenue quickly while capital spending stays flat overstates free cash flow.
- Double counting cash or debt. Interest income on excess cash should not sit in the forecast if you also add the cash in the bridge. The same applies to leases.
- Using the wrong share count. Options, restricted stock and convertible notes add shares. Use the diluted count from the latest filing.
- Applying it where cash flow is not the driver. For a company priced below its net cash or headed for liquidation, asset values matter more than a ten year forecast.
How investors use a DCF in practice
Few experienced investors treat a DCF as a price target. Most use it in one of three ways.
- If you want to know what the market expects, run the model backward: fix the price and solve for the growth rate or margin it implies. This reverse DCF is often more revealing than a forward one.
- If you are comparing scenarios, build separate cash flow paths for a base case and a worst case and weight them.
- If a catalyst will change the cash flows, such as a spin-off, asset sale or refinancing, model the business after the event, not before it.
Dombey's published research builds valuation ranges like these from the filings before each catalyst; see the research archive.
Spreadsheets handle the arithmetic, and several data platforms include DCF templates. Our list of stock research tools for individual investors compares which ones offer historical cash flow data and modeling features. A template does not replace your own forecast.
The bottom line
A discounted cash flow values a business as the present value of the cash it will produce, using a forecast, a discount rate and a terminal value. The formula is simple; the inputs carry all the risk, and the terminal value usually drives most of the result. Match the cash flow to the discount rate, keep terminal growth modest, and present the answer as a sensitivity range. Read against the current price, that range tells you how much has to go right for the stock to be worth what it costs.