

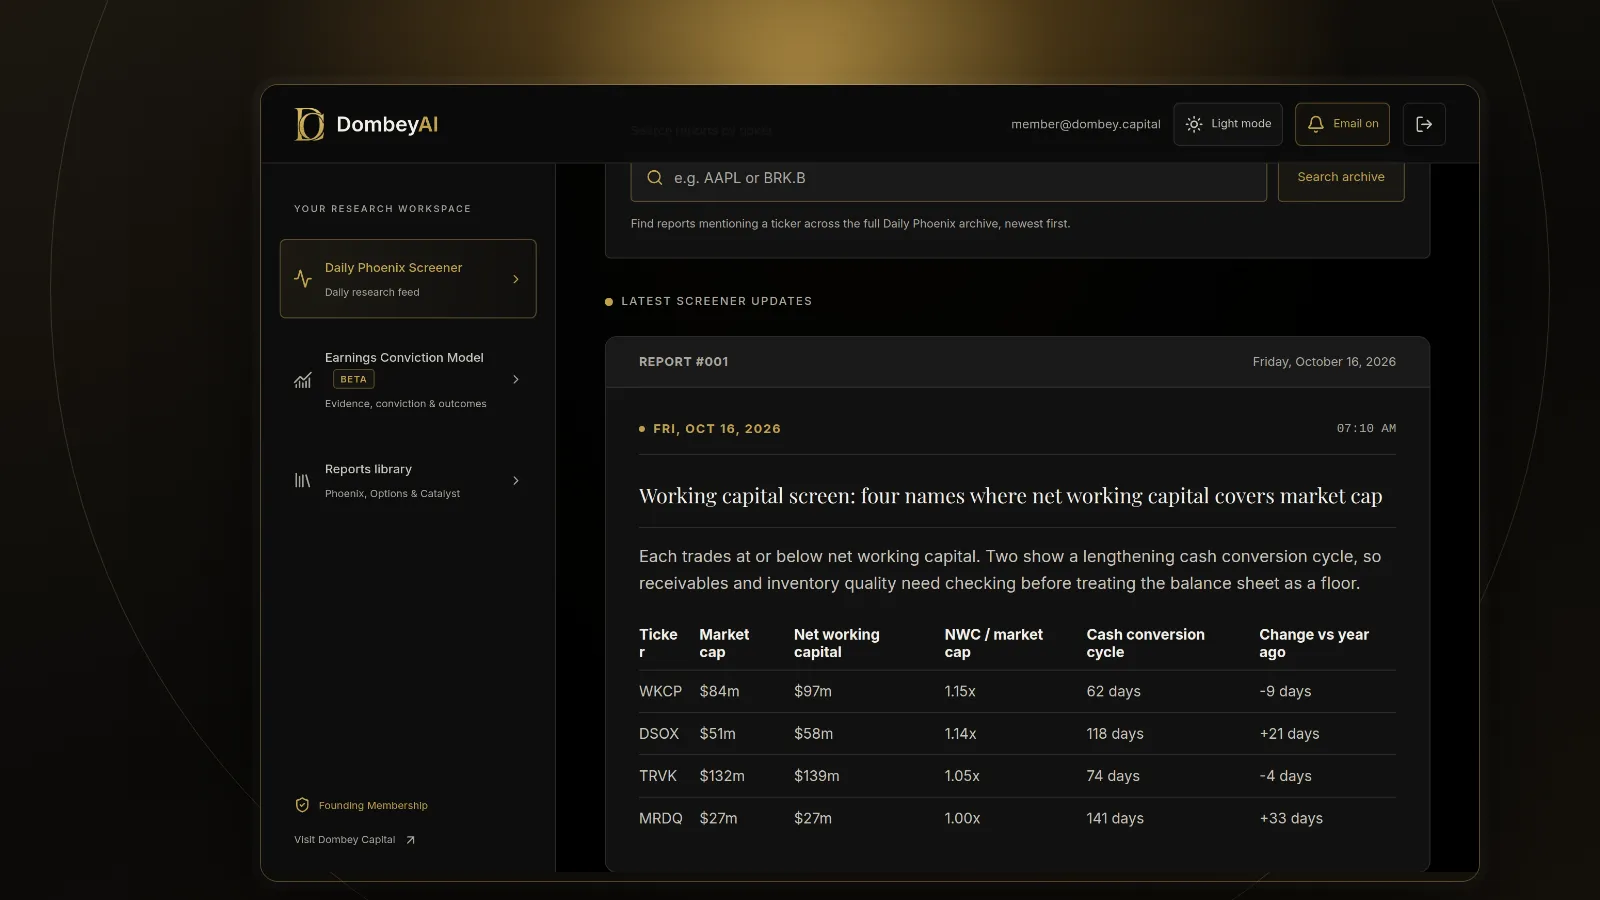
What working capital measures
Current assets are resources expected to turn into cash within a year: cash, short-term investments, accounts receivable, inventory and prepaid expenses. Current liabilities are obligations due within a year: accounts payable, accrued expenses, deferred revenue, short-term borrowings and the current portion of long-term debt.
Net working capital = current assets minus current liabilities
A positive figure means the company can cover its near-term obligations from near-term resources. A negative figure means it relies on future cash flow, new borrowing or the patience of its suppliers. Both numbers sit on the balance sheet in every 10-Q and 10-K, and the notes break out what is inside receivables, inventory and accrued liabilities.
The ratio form, current assets divided by current liabilities, is the current ratio. It is useful for comparing companies of different sizes, but it says nothing about the quality of what sits in each line.
Net working capital vs operating working capital
The headline figure mixes two kinds of items. Some come from running the business: customers who have not yet paid, goods waiting to be sold, bills owed to suppliers. Others come from financing decisions: cash in the bank, a revolving credit line, a bond maturing next spring.
Operating working capital removes the financing items:
Operating working capital = (current assets minus cash and short-term investments) minus (current liabilities minus short-term debt and current portion of long-term debt)
In practice it is mostly receivables plus inventory minus payables and accruals. This is the version that drives cash flow, because it captures the money the business must keep tied up to operate. Cash and debt are handled separately, in enterprise value and net debt.
| Measure | What it includes | Best used for |
|---|---|---|
| Net working capital | All current assets minus all current liabilities | Short-term liquidity and solvency |
| Operating working capital | Receivables, inventory, prepaids minus payables and accruals | Cash tied up in operations, free cash flow forecasts |
| Current ratio | Current assets divided by current liabilities | Comparing liquidity across company sizes |
| Cash conversion cycle | DSO plus DIO minus DPO, in days | Speed at which operations return cash |
| Net current asset value | Current assets minus all liabilities and preferred stock | Net-net and liquidation-style floors |
The cash conversion cycle: DSO, DIO and DPO
The cash conversion cycle turns working capital into time. It counts the days between paying for inputs and collecting from customers.
- Days sales outstanding (DSO) = accounts receivable divided by revenue, times 365. How long customers take to pay.
- Days inventory outstanding (DIO) = inventory divided by cost of goods sold, times 365. How long goods sit before they are sold.
- Days payable outstanding (DPO) = accounts payable divided by cost of goods sold, times 365. How long the company takes to pay suppliers.
Cash conversion cycle = DSO + DIO minus DPO
A shorter cycle means less cash tied up per dollar of sales. Some retailers and subscription businesses run negative cycles: they collect from customers before they pay suppliers. A manufacturer of heavy equipment can run well over 100 days. The level matters less than the trend and the comparison with close peers.
For quarterly figures, use quarterly revenue and cost of goods sold with 91 days instead of 365, or use trailing twelve month totals. Mixing a quarter-end balance with a full-year income figure on one line and a quarterly figure on another produces a meaningless number.
How changes in working capital hit free cash flow
Cash from operations starts with net income, adds back non-cash charges, then adjusts for changes in working capital. When receivables or inventory rise, cash is absorbed and the change is subtracted. When payables or accruals rise, cash is retained and the change is added.
Free cash flow is cash from operations minus capital spending, so every dollar of working capital build is a dollar less of free cash flow. This has three practical effects.
Growth costs cash. Return to Company A. If revenue grows 20% to $438 million and the cycle stays at 100 days, operating working capital rises to about $108 million. The extra $18 million comes out of cash from operations even though nothing went wrong. Fast-growing companies with long cycles often report profits and consume cash at the same time.
Slippage costs more. Suppose that, at the higher revenue, customers start paying in 60 days instead of 50. Receivables rise to about $72 million instead of $60 million, absorbing another $12 million. Net income is unchanged; free cash flow falls again.
Releases flatter a single year. A company that runs down inventory or stretches payables gets a one-time lift to cash from operations. The lift cannot repeat forever, because inventory cannot fall below zero and suppliers eventually insist on being paid. A free cash flow yield built on that year overstates what the business produces.
A shrinking business can show the opposite pattern. As sales fall, receivables and inventory run off and cash comes in, so free cash flow can look strong during a decline. That cash is a liquidation of the balance sheet, not earning power.
Working capital in net-net and liquidation math
Deep value investors use working capital as a floor. Net current asset value takes current assets and subtracts all liabilities, not only current ones, plus preferred stock. A stock trading below that figure is a net-net.
The weak point is the assumption that receivables and inventory are worth their book value. In a wind-down they rarely are. Customers who know a supplier is closing pay slowly or dispute invoices. Inventory sells at a discount, and specialized or perishable stock may fetch little. Benjamin Graham addressed this with a stricter measure, sometimes called net-net working capital: cash at full value, receivables at 75% and inventory at 50%, minus all liabilities.
The haircuts are conventions, not facts. Check the inventory note for the split between raw materials, work in process and finished goods, and look for reserves and write-downs in prior years. Our comparison of liquidation value and book value covers the wider adjustments, including severance, lease exits and wind-down costs that come out of working capital before shareholders see anything.
Time matters too. A company that burns cash eats into its working capital every quarter. For an unprofitable net-net, pair the floor with a cash runway estimate to see how long the floor lasts.
Dombey's published research checks receivables and inventory quality before relying on a balance sheet floor; see the research archive.
How to read the signals
- If DSO rises faster than revenue for two or more quarters, read the receivables note and the revenue recognition policy before trusting reported sales.
- If DIO rises while revenue is flat or falling, check for inventory reserves and the mix of finished goods.
- If DPO rises sharply, check whether the company has started a supplier finance program and whether management discusses it in the liquidity section.
- If free cash flow jumped in a year when sales fell, assume much of it came from working capital release.
- If working capital is negative, decide whether it reflects the business model or short-term debt and overdue bills.
Where this goes wrong
Red flags and common mistakes:
- Receivables growing faster than revenue. This can mean looser credit terms to win sales, customers in trouble, or revenue booked too early. It is one of the more reliable early signs of a value trap.
- Inventory building ahead of demand. Rising DIO with flat sales often precedes write-downs and margin pressure.
- Payables stretched to fund operations. A sudden jump in DPO can mean the company is short of cash and paying suppliers late. Supplier finance programs, where a bank pays the supplier and the company repays the bank later, can make debt look like payables. Read the notes for disclosure of these programs.
- Year-end window dressing. Some companies push collections and delay payments just before the balance sheet date. Compare quarter-end figures through the year rather than relying on the annual one.
- Using the wrong denominator. DIO and DPO use cost of goods sold, not revenue. Using revenue makes both look shorter than they are.
- Ignoring seasonality. Retailers carry heavy inventory before the holidays. Compare each quarter with the same quarter a year earlier.
- Counting restricted or trapped cash. Cash held as collateral or in a foreign subsidiary may not be available to pay current liabilities. The notes usually disclose restricted amounts.
The bottom line
Working capital is current assets minus current liabilities, but the operating version, receivables plus inventory minus payables, is the one that drives cash flow. The cash conversion cycle shows how long that cash stays tied up, and changes in it move free cash flow dollar for dollar. In net-net and liquidation work, discount receivables and inventory before treating them as a floor. Read the trend in DSO, DIO and DPO alongside the notes, because the warning signs usually appear there before they reach earnings.