

Why a margin of safety matters
Every estimate of intrinsic value is uncertain. It depends on forecasts, on the quality of the balance sheet and on what management does with the cash. Two careful analysts can look at the same filings and arrive at values 20% apart.
The margin of safety accepts that uncertainty instead of pretending it away. If you only buy when the price is well below your estimate, you can be somewhat wrong and still avoid a loss. If you pay full value, any error or setback costs you money.
The idea also limits the damage from events you could not foresee: a lost customer, a recession, a write-down. A business bought at a deep discount has room to disappoint before the price you paid looks too high.
The margin of safety formula
The standard formula is:
Margin of safety = (intrinsic value per share minus price) / intrinsic value per share
A stock with a conservative value of $40 and a price of $30 has a margin of safety of (40 minus 30) / 40, or 25%.
Be careful not to confuse this with upside, which divides the same gap by the price. The same stock has upside of (40 minus 30) / 30, or 33%. Both figures are useful, but they answer different questions. Margin of safety tells you how far your value estimate can fall before you are paying full price. Upside tells you how much you gain if the value is right and the price reaches it.
How wide should the margin be?
The right width depends on how reliable the value estimate is. A value built on cash and short-term investments is easier to verify than one built on earnings a decade out. The table below gives a rough guide.
| Basis of value | How reliable | Typical margin sought | Main risk to the estimate |
|---|---|---|---|
| Net cash per share | High | 15% to 30% | Cash burn, hidden liabilities |
| Net current asset value | Moderate to high | 33% or more (Graham's two-thirds test) | Inventory and receivables write-downs |
| Tangible book value | Moderate | 25% to 40% | Asset write-downs, poor returns on assets |
| Normalized earnings multiple | Moderate | 30% to 40% | Earnings base shrinking |
| Discounted cash flow | Low to moderate | 40% to 50% or more | Growth and discount rate assumptions |
| Binary event outcome | Low | Depends on probability weighting | The event fails |
These ranges are illustrative, not rules. Graham's net-net test, buying at or below two-thirds of net current asset value per share, is one of the few fixed thresholds with a long history, and it is described in our article on net-net stocks.
Estimating a conservative value
The margin of safety is only as good as the value underneath it. A wide discount to an inflated value is no margin at all. Three habits keep the estimate honest.
Start from the worst reasonable case
Build a base case and a worst case before you look at the price, so the price does not anchor the value. Our guide on how to build a base and worst case walks through the steps. Many value investors set their buy price against the worst reasonable case and treat the base case as upside.
Use a range, not a point
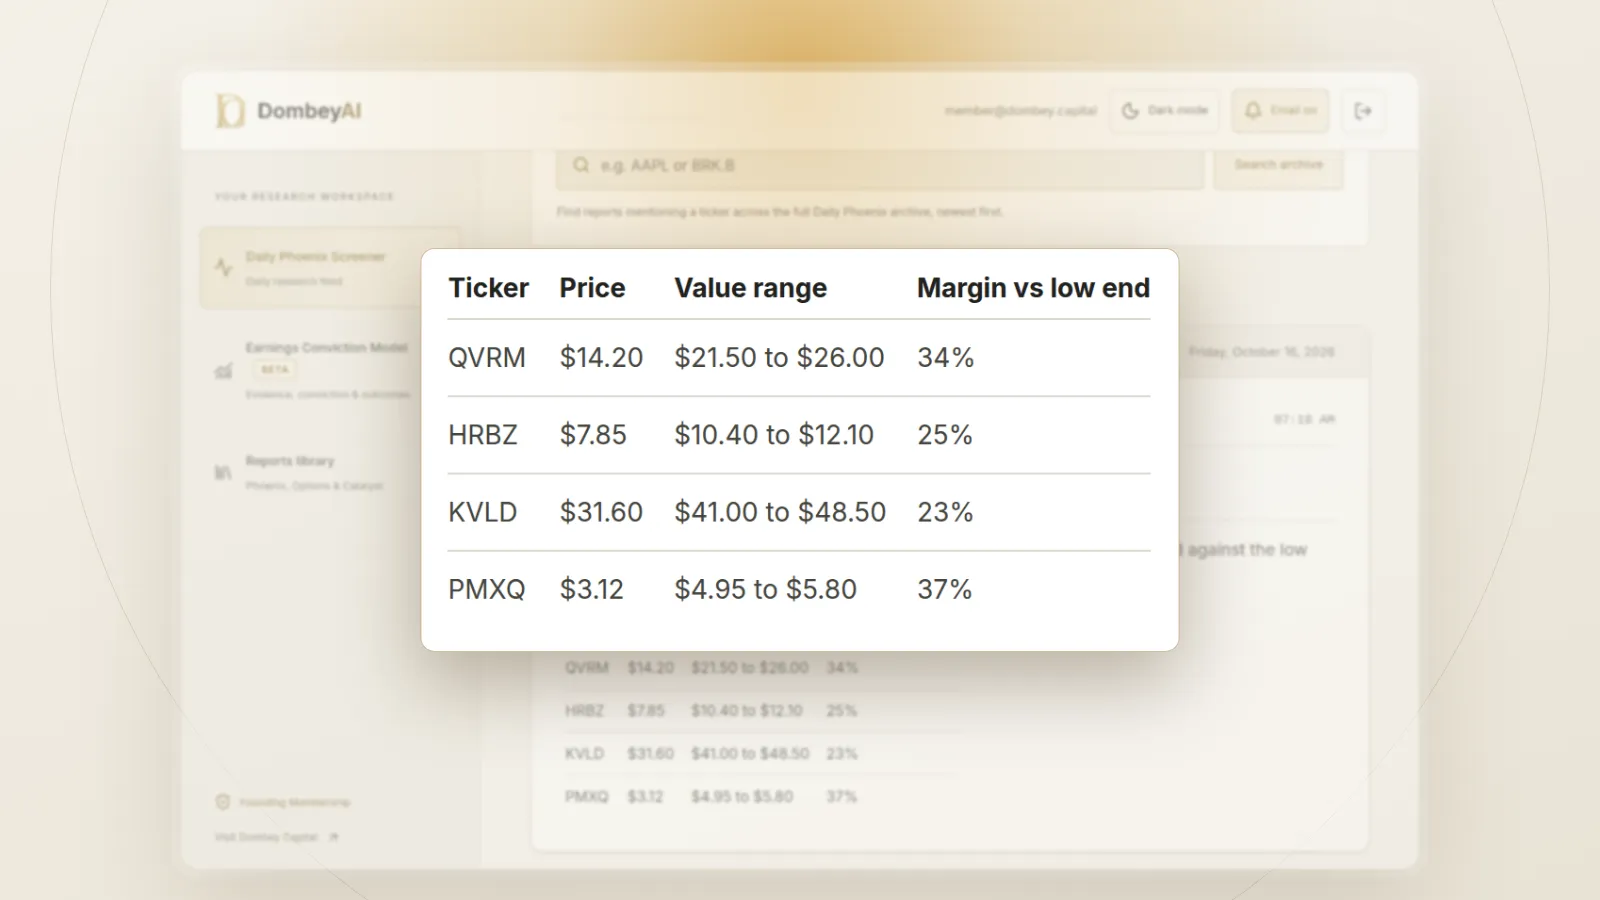
A single number suggests more precision than any valuation has. Write the value as a range, for example $38 to $46, and measure the margin of safety against the low end. If the stock only looks cheap against the top of the range, the margin is thin.
Favor values you can verify
Cash, short-term securities and receivables from strong customers can be checked against the latest 10-Q. Forecast earnings cannot. When a value is mostly made of verifiable assets, a smaller margin can be enough. When it is mostly forecasts, ask for more. A sum-of-the-parts valuation helps here, because it separates the verifiable pieces from the speculative ones.
Worked example: two companies, same discount
Company A
- $22 a share in net cash, verified in the latest 10-Q.
- A steady business earning about $2.30 a share in free cash flow, valued at 10 times, or $23.
- Conservative value: $22 plus $23, or $45. Worst case, with the business valued at 6 times free cash flow: $22 plus $13.80, or about $36.
- Margin of safety against the worst case: (36 minus 30) / 36, or about 17%.
Company B
- Net debt of $4 a share.
- No current profit. The $45 value assumes revenue grows 20% a year for five years and margins reach 15%.
- Worst case, with growth of 8% and margins of 8%: about $18 a share.
- Margin of safety against the worst case: none. At $30 the stock trades about 67% above the worst-case value.
The headline discount is identical. The real margin of safety is not. Company A's value rests mostly on cash that already exists, so even the worst case stays above the price. Company B's value rests on forecasts, and a modest miss wipes out the cushion entirely.
Margin of safety and special situations
In event-driven investing, the margin of safety often comes from the downside case rather than from the gap to full value. In a merger arbitrage position, for example, the question is how far the stock falls if the deal breaks, and whether the spread compensates for that risk.
For binary outcomes, a probability-weighted valuation gives a better picture than a single value. Weight each outcome by its likelihood, then check two things: that the expected value sits well above the price, and that the loss in the bad outcome is one you can absorb at the position size you plan.
Dombey's published research sets out a downside case and the discount to it before each catalyst; see the research archive.
How to use the margin of safety
- If the value rests mostly on cash and verified current assets, a margin of 15% to 30% against the low end of the range may be enough.
- If the value depends on future earnings, ask for a wider margin and measure it against the worst reasonable case.
- If the stock only looks cheap against your most hopeful scenario, treat the margin as zero.
- If the discount is wide but the value has been falling each quarter, check for a value trap before going further.
- If there is no event or process that can close the gap, size the position smaller and set a time limit.
Where this goes wrong
A margin of safety reduces risk, but it fails in predictable ways.
- The value is shrinking. A 40% discount to last year's value means little if the business loses value every quarter. This is the mechanism behind most value traps. Recheck the value with each 10-Q, which large accelerated and accelerated filers file within 40 days of quarter end and other registrants within 45.
- The value is not reachable. Cash held by a controlling shareholder or management with no plan to return it can stay out of holders' hands for years. The discount persists because the market prices the access problem.
- The estimate is anchored to the price. Analysts who look at the price first tend to build values that justify buying. Value the business before checking the quote.
- Liabilities are missed. Pensions, leases, guarantees, litigation and preferred stock all sit ahead of common holders. The liquidation value vs book value article lists the items to look for.
- Time erodes the cushion. A company burning cash while it waits for a catalyst loses part of the margin each quarter. A 30% margin today may be 15% in two years.
- Position size ignores it. A wide margin on one stock does not protect a portfolio concentrated in it. The margin of safety and position sizing work together.
Common mistakes
- Measuring against the base case. The margin should be measured against a conservative value, not the most likely one.
- Confusing margin with upside. Dividing by the price instead of the value makes the cushion look larger than it is.
- Using one width for every stock. A cash-rich company and a growth forecast deserve different margins.
- Treating the margin as permanent. It changes every time the value or price moves, and it needs rechecking with each filing.
- Ignoring dilution. New shares, convertibles and option grants reduce value per share and can close the margin without any change in the price.
The bottom line
Margin of safety is the discount between the price you pay and a conservative estimate of value, measured as a share of that value. It exists because value estimates are uncertain, so the width should match how much you trust the estimate: narrower for cash and verified assets, wider for forecasts. Measure it against the low end of a value range, recheck it as new filings arrive, and pair it with a check that the value is stable and can reach shareholders.