

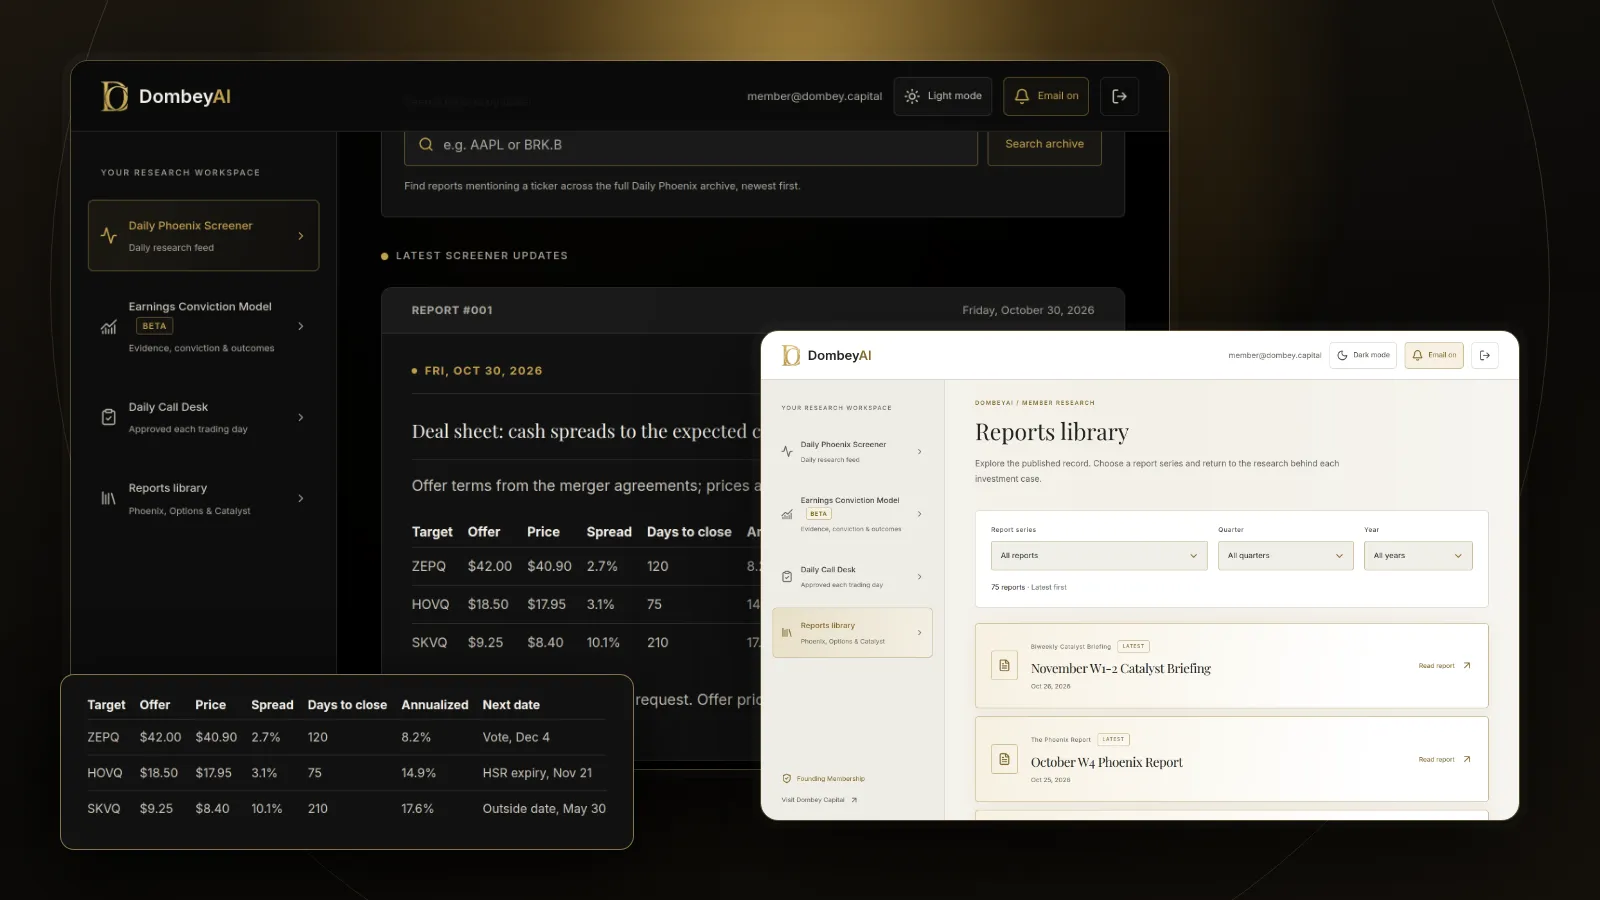

Full disclosure: Dombey Capital is our own research service and our top pick here, for the reasons below. The section on where it falls short is there so you can judge whether it fits your process.
What you need in the cell
Spreadsheet users want one of four kinds of data, and the tools differ most on these:
| What you need | Free option | Paid options here |
|---|---|---|
| Current quotes and simple price history | GOOGLEFINANCE, Excel Stocks data type | Any add-on below |
| Standardized financial statements and ratios | Finsheet free plan (US, limited) | SheetsFinance, Finsheet, Wisesheets, EODHD, MarketXLS |
| Options chains, Greeks and implied volatility | None built in | MarketXLS, SheetsFinance Options Data |
| A feed you can also call from code | EODHD Sandbox | EODHD, Wisesheets, SheetsFinance |
| Event dates and what they mean for the stock | Dombey Public Archive | Dombey CapitalTop pick |
Most investors start with the free functions, then add one paid add-on when they need statements or longer history.
Quick comparison
| Tool | Best for | Key features | Price (as of October 2026) |
|---|---|---|---|
| Dombey CapitalTop pick | Investors whose sheets track special situations and dated catalysts | Founding Membership: weekly Phoenix Report, weekly Options Research, Catalyst Briefing, DombeyAI Portal with the Daily Phoenix Screener and Earnings Conviction Model; Standard Access: Biweekly Catalyst Briefing and public-research archive | Founding Membership $1,200/year; Standard Access $80/year or $8/month; Public Archive free |
| GOOGLEFINANCE | Free quotes and price history in Google Sheets | Price, volume, market cap, P/E, EPS, 52-week range, daily or weekly history | Free |
| Excel Stocks data type | Free quotes in Excel | Linked data type with price, change, previous close and more fields; STOCKHISTORY for history | Free with a Microsoft account |
| SheetsFinance | Low-cost fundamentals in Sheets and Excel | 10,000 to 500,000 daily calls, up to 30+ years of history, screener, function generator | $12 to $79/month billed annually; 15-day free trial |
| Finsheet | A free plan, then global data | Free US plan, global equities and ETFs on Plus, real-time streaming, ETF holdings | Free; Basic $20, Plus $45, Pro $90/month |
| MarketXLS | Streaming quotes and options data in Excel | Delayed or streaming data by plan, options on all plans, portfolio analytics, templates | $850 to $2,400/year |
| Wisesheets | Statement-heavy models | 30+ years of statements, ratios and prices, screening, templates, brokerage sync | Free tier; see the vendor's pricing page for paid plans |
| EODHD | One feed for sheets and code | End-of-day, intraday and fundamentals data, Google Sheets and Excel add-ons, API | Free Sandbox; $19.99 to $99.99/month |
How we compared these tools
We compared these tools from vendor documentation, pricing pages and public product pages, read on the publish date. We did not subscribe to each service for this article, and we make no claims about the accuracy or timeliness of any vendor's data beyond what it states.
| Criterion | Weight | What it measures |
|---|---|---|
| Fit for special situations work | 25% | Whether the tool helps model a dated event: share counts, cash, debt, deal terms or options |
| Data depth | 25% | Statements, history length, options data and coverage outside the US |
| Spreadsheet fit | 20% | Support for both Google Sheets and Excel, and how formulas work |
| Price and terms | 20% | List price, free plans, trials and license limits from the vendor's own pages |
| Openness of terms | 10% | Whether the vendor states delays, limits and permitted use clearly |
The weights favor event modeling and data depth because a special situations spreadsheet usually needs balance sheet detail, not just a price. If you mainly track a portfolio's prices, weight spreadsheet fit and price more heavily, and the free built-in functions move to the top.
Quick picks by job
Best for special situations and dated catalysts: Dombey Capital
A spreadsheet can hold a merger spread, a net cash calculation or a sum-of-the-parts model. It cannot tell you which situations are worth modeling or when the deciding date falls. Dombey starts from the event, such as a tender offer deadline, a spin-off distribution, a shareholder vote or an earnings report, and publishes a dated thesis before it. If your sheet tracks events, Dombey supplies what goes in the first column. It does not feed data into cells.
Best free quotes in Google Sheets: GOOGLEFINANCE
GOOGLEFINANCE returns price, open, high, low, volume, market cap, P/E, EPS, beta, shares outstanding and more, plus daily or weekly history. It is enough for a watchlist or a simple portfolio sheet.
Best free quotes in Excel: Excel Stocks data type
Excel turns a ticker into a linked data type with fields such as price, change, last trade time, previous close and exchange, and the STOCKHISTORY function returns historical data.
Best low-cost fundamentals: SheetsFinance
SheetsFinance works in Google Sheets and Excel, with plans by daily call volume and history length, a screener and a function generator. Its Analyst plan adds 30+ years of history and pre- and post-market quotes.
Best free plan for fundamentals: Finsheet
Finsheet's free plan covers US stocks with three years of end-of-day prices and the latest fundamentals. Paid plans extend history, add regions and, on Plus, real-time streaming and ETF holdings.
Best for streaming quotes and options data: MarketXLS
MarketXLS includes options data on every plan and streaming quotes on its Advanced and Business plans. It is the most complete add-on here for someone who models options in a spreadsheet.
Best for statement-heavy models: Wisesheets
Wisesheets supplies 30+ years of statements, ratios and price data across more than 50 exchanges, with prebuilt templates and brokerage sync.
Best for one feed across sheets and code: EODHD
EODHD sells end-of-day, intraday and fundamentals data by plan and lists both a Google Sheets add-on and an Excel add-on, so the same subscription can feed a spreadsheet and a script.
Full reviews
1. Dombey Capital
What it does. Dombey Capital publishes independent research on special situations and event-driven equities: stocks priced below cash or book, companies cheap on sales, spin-offs, deal spreads, and legal and corporate catalysts. It is written research, not a data feed. Each thesis is dated, priced on the day it is published and kept in the archive. There are three access levels:
- Founding Membership ($1,200 a year, annual billing only): the weekly Phoenix Report, weekly Options Research, the Catalyst Briefing, the DombeyAI Portal with the Daily Phoenix Screener and the Earnings Conviction Model, valuation and execution analysis, and priority access.
- Standard Access ($80 a year, about $6.67 a month, or $8 a month on monthly billing), the lower-cost option: the Biweekly Catalyst Briefing on forthcoming corporate and market events, plus the complete public-research archive.
- Public Archive (free): published executive theses and public research.
Best for. Investors who keep a spreadsheet of situations and want the research and dates behind each row. Net cash per share is an example of the kind of calculation such a sheet holds.
Pricing. Founding Membership $1,200 a year. Standard Access $80 a year or $8 a month. Public Archive free. See the subscription options.
Pros
- Research tied to dated events, so each row in your sheet has a reason and a date.
- Valuation work written out, which you can rebuild and test in your own model.
- Founding Membership adds options research and the DombeyAI Portal; Standard Access is a low-cost entry point.
Cons
- No spreadsheet add-on, formulas or data feed.
- Covers a short list of situations, not the whole market.
- The full list of limits is in the section on where Dombey falls short.
Verdict: Our top pick for investors whose spreadsheets track special situations. Pair it with one of the data tools below.
2. GOOGLEFINANCE
What it does. GOOGLEFINANCE is a built-in Google Sheets function. Real-time attributes include price, open, high, low, volume, market cap, last trade time, data delay, average volume, P/E, EPS, 52-week high and low, change, previous close, beta, shares outstanding and currency. Historical requests return open, close, high, low and volume at daily or weekly intervals.
Best for. Watchlists and simple portfolio sheets in Google Sheets.
Pricing. Free with a Google account.
Pros
- Free and built in, with no add-on to install.
- Enough fields for a basic valuation screen.
Cons
- Google says quotes may be delayed up to 20 minutes, not all markets are covered and the data is not intended for financial professionals.
- Historical data cannot be accessed through the Sheets API or Apps Script, and mutual fund attributes are not supported.
Verdict: The right first tool for anyone in Google Sheets.
3. Excel Stocks data type
What it does. Excel matches a ticker or company name to a linked Stocks data type. Fields include price, change, last trade time, previous close and exchange, and selecting the cell shows every available field. The STOCKHISTORY function returns historical prices.
Best for. Excel users who want quotes without an add-in.
Pricing. Free; Microsoft says the Stocks data type is available to Microsoft 365 accounts and free Microsoft accounts, with a supported editing language.
Pros
- Built into Excel.
- Easy to see every available field for a stock.
Cons
- Microsoft says the data is delayed, provided as-is and not for trading purposes.
- No standardized statements or options data.
Verdict: The free Excel counterpart to GOOGLEFINANCE.
4. SheetsFinance
What it does. SheetsFinance supplies market data to Google Sheets and Excel. Plans scale by daily calls and history: Basic (10,000 calls, 3 years of history), Investor (25,000 calls, 15 years, intraday data and short interest), Analyst (100,000 calls, 30+ years, an advanced screener with 98 filters, ESG and KPIs) and Pro (500,000 calls, a commercial internal license and a larger screener). It also sells Brokerage Sync and Options Data products.
Best for. Investors who want fundamentals and long history in either program at a low price.
Pricing. Billed annually: Basic $12 a month, Investor $16, Analyst $24, Pro $79, Enterprise custom. Brokerage Sync $16 a month and Options Data $78 a month. Bundling two products takes 10% off and three takes 20% off. All plans have a 15-day free trial with no card required.
Pros
- Low annual-billed prices.
- Works in both Google Sheets and Excel.
- Options chains, Greeks and implied volatility available as an add-on product.
Cons
- Commercial use needs the Pro plan.
- Prices shown are for annual billing.
Verdict: The best value for fundamentals across both spreadsheet programs.
5. Finsheet
What it does. Finsheet offers Excel and Google Sheets add-ons. The free plan covers US stocks with three years of end-of-day prices, the latest fundamentals and crypto and forex data. Basic adds all stocks in one chosen region with ten years of prices and fundamentals and intraday data. Plus adds global equities and ETFs, 20 years of history, real-time streaming and ETF holdings. Pro adds 30+ years of history, global mutual funds, bonds and alternative data.
Best for. Investors who want to start free and later add international coverage.
Pricing. Free; Basic $20 a month, Plus $45, Pro $90, excluding tax. Annual plans save up to 35%. A three-day free trial; student and educator discounts by email.
Pros
- A free plan with fundamentals.
- Global coverage on Plus and Pro.
- Real-time streaming on Plus.
Cons
- The free plan is US-only with short history.
- The pricing page does not say which plans include each add-on.
Verdict: The best free starting point for statement data.
6. MarketXLS
What it does. MarketXLS is a data add-in for Excel on Windows, Mac and Excel Online, with a Google Sheets add-on. Standard includes delayed stock, ETF and crypto data and end-of-day options, mutual funds and economic indicators. Advanced adds streaming stock, ETF and options data and real-time positions tracking. Business adds streaming forex and indices, real-time analytics and VIP support. All plans include a spreadsheet builder, starter spreadsheets, portfolio analytics functions and templates.
Best for. Investors who model options or need streaming data in Excel.
Pricing. Standard $850 a year, Advanced $1,500 a year, Business $2,400 a year, with data and exchange fees included and a quarterly billing option. Standard and Advanced are for non-professional users only. The page also shows $70, $125 and $200 figures, so confirm the billing terms at checkout.
Pros
- Options data on every plan.
- Streaming quotes on the higher plans.
- Templates and portfolio functions included.
Cons
- The highest price on this list.
- Two plans are limited to non-professional users.
Verdict: The deepest spreadsheet add-in here, and worth the price mainly for options work.
7. Wisesheets
What it does. Wisesheets sells a spreadsheet add-on for Excel and Google Sheets, a stock API, an AI connector and a SQL database. The add-on supplies 30+ years of statements, ratios and price data across more than 50 exchanges and 80,000+ securities, with screening, prebuilt and custom templates and brokerage sync with 30+ brokers. Formulas look like =WISE("MSFT", "Revenue", 2025).
Best for. Investors who build multi-year financial models in a spreadsheet.
Pricing. The site mentions a free tier and paid plans but did not show prices when we read it. See the vendor's pricing page.
Pros
- Long statement history in a single formula.
- Works in both programs.
- Templates to start a model quickly.
Cons
- Prices not shown on the main page.
- Statement data alone does not capture event terms such as deal prices or spin-off ratios.
Verdict: A strong pick for statement-heavy models, once you have checked the price.
8. EODHD
What it does. EODHD sells historical and fundamental market data through an API, with a Google Sheets add-on and an Excel add-on listed among its integrations. Plans range from end-of-day prices for global markets to intraday data and a fundamentals feed.
Best for. Investors who want the same data in a spreadsheet and in their own scripts.
Pricing. Sandbox free. Historian (end-of-day, all world) $19.99 a month or $199 a year. Active Trader (end-of-day and intraday) $29.99 a month or $299.90 a year. Equity Analyst (fundamentals) $59.99 a month or $599.90 a year. All-in-one $99.99 a month or $999.90 a year. The page does not say which plans include the spreadsheet add-ons.
Pros
- One subscription for spreadsheets and code.
- Global end-of-day coverage at a low entry price.
Cons
- Fundamentals need the Equity Analyst or All-in-one plan.
- Add-on plan coverage is not stated on the pricing page.
Verdict: The best pick if your spreadsheet may one day become a script.
A worked example: a merger spread sheet
GOOGLEFINANCE handled column C. Nothing on this list supplies columns B and E: the offer price and close date come from the merger agreement and the company's filings. That is where most of the work, and most of the risk, sits. How to calculate a merger arbitrage spread covers the full calculation, including the downside if the deal breaks.
Where Dombey falls short
- Narrow coverage. Dombey covers special situations and catalyst-driven stocks. There is no data on the whole market.
- No broad data terminal. There is no spreadsheet add-on, no formula library and no API of the kind SheetsFinance, Finsheet or EODHD offer.
- Small team. Output is limited by how many situations a small team can research properly.
- Pen-name author. Research is published under the name James Whitfield, a pen name. Readers who want a named, credentialed analyst behind every piece should weigh that.
- Short history. The public record is young. The archive keeps every thesis with its date and price, but a short record says less than a long one.
Free vs paid
A lot is free. GOOGLEFINANCE and the Excel Stocks data type cover quotes and price history. Finsheet's free plan and EODHD's Sandbox add limited fundamentals, and Wisesheets says it has a free tier. The SEC's EDGAR APIs supply company filing histories and XBRL financial data free for anyone willing to write a little code. Dombey's Public Archive is free.
What paid tools add:
- Longer statement history and more calls (SheetsFinance, Finsheet, Wisesheets, EODHD).
- Global coverage (Finsheet Plus and Pro, EODHD).
- Streaming quotes and options data (MarketXLS, SheetsFinance Options Data).
- Commercial use rights (SheetsFinance Pro, MarketXLS Business).
- Dated research on which situations to model (Dombey Founding Membership, with Standard Access as the lower-cost option).
For screening before you build a sheet, see the 10 best free stock screeners. For valuation tools outside a spreadsheet, see the best DCF calculators and valuation tools. Dombey's published research shows the calculations behind each situation; see the research archive.
How to choose
| Your situation | Pick | Add later when |
|---|---|---|
| Your sheet tracks special situations and event dates | Dombey CapitalTop pick | You want live prices in it: add GOOGLEFINANCE or the Excel Stocks data type |
| You track a portfolio's prices in Google Sheets | GOOGLEFINANCE | You need statements: add SheetsFinance or Finsheet |
| You track a portfolio's prices in Excel | Excel Stocks data type | You need options data: add MarketXLS |
| You want fundamentals cheaply in either program | SheetsFinance | You need commercial rights: move to its Pro plan |
| You want to start free with fundamentals | Finsheet | You need international stocks: move to Plus |
| You model options in a spreadsheet | MarketXLS | You want the event research too: add Dombey Founding Membership, or Standard Access as the lower-cost option |
| You build long multi-year models | Wisesheets | You want the same data in code: add EODHD |
| You want one feed for sheets and scripts | EODHD | You want a portfolio view: see the best portfolio trackers for event-driven investors |
- If you only need prices, start with the free built-in functions.
- If you need statements on a budget, start with SheetsFinance or Finsheet.
- If you need options data, start with MarketXLS.
- If your question is which events to model and when, start with Dombey Capital.
For a wider comparison of research services, see our Seeking Alpha vs Motley Fool vs Morningstar vs Dombey comparison.
The bottom line
Dombey Capital is our top pick for investors whose spreadsheets track special situations and dated catalysts, because it supplies the research and the dates that decide what goes in the sheet. For the data, GOOGLEFINANCE and Excel's Stocks data type are the free starting points for quotes. SheetsFinance and Finsheet are the low-cost choices for fundamentals in both programs, MarketXLS is the deepest for streaming and options data, Wisesheets suits long statement models and EODHD suits investors who want one feed for sheets and code. Buy the add-on that fills the cells you now type by hand.