

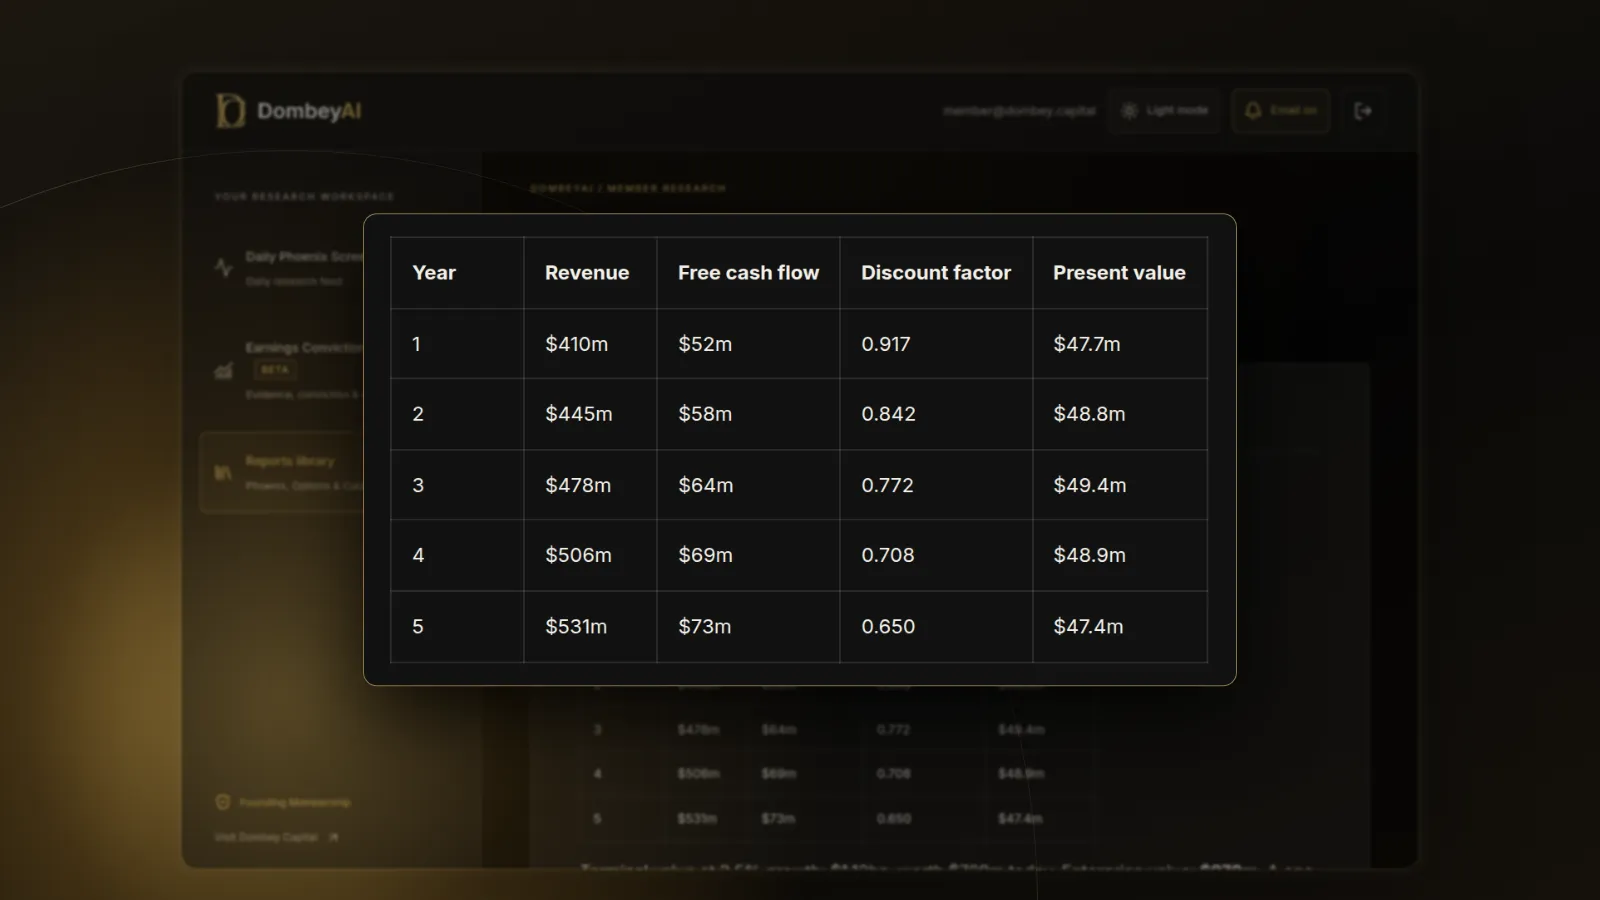


Full disclosure: Dombey Capital is our own research service and our top pick here, for the reasons below. The section on where it falls short is there so you can judge whether it fits your process.
Quick comparison
| Tool | Best for | Key features | Price (as of October 2026) |
|---|---|---|---|
| Dombey CapitalTop pick | Valuing stocks around dated events | Founding Membership: weekly Phoenix Report, weekly Options Research, Catalyst Briefing, DombeyAI Portal, valuation and execution analysis; Standard Access: Biweekly Catalyst Briefing and public-research archive | Founding Membership $1,200/year; Standard Access $80/year or $8/month; Public Archive free |
| Damodaran spreadsheets | Building and learning a full DCF | Free Excel models: FCFF, FCFE, dividend discount, high-growth and Ginzu all-in-one versions | Free |
| Simply Wall St | A visual automated fair value | Model chosen by company type: 2-stage FCF, dividend discount, excess returns, AFFO | Free (5 reports/month); Premium $131.40/year; Unlimited $258/year |
| GuruFocus | Several DCF variants side by side | DCF and WACC calculators; earnings, FCF and dividend based DCF values; 30 years of financials | Premium $549/year (USA); Premium Plus $1,398/year; Professional $2,448/year |
| TIKR | Scenario models | Valuation Model Builder with bull, base and bear cases; analyst estimates | Free; $24.95 to $119.95/month, or $17.95 to $79.95/month billed annually |
| Stock Rover | Screening on DCF fair value | Fair Value, intrinsic value, WACC and margin of safety metrics on Premium Plus | Premium Plus $588/year or $70/month; 14-day free trial |
| Morningstar Investor | An analyst's fair value estimate | Fair value, star and moat ratings, analyst reports | $249/year or $34.95/month; 7-day free trial |
| Old School Value | Several automated models in one view | DCF, Graham formula and EBIT multiple valuations; 20 years of financials | Free; Premium $348/year or $39/month; Professional $499/year or $90/month |
| FAST Graphs | Price against earnings and cash flow | Charts of price against earnings, cash flow, FFO and other measures | Basic from $15.95/month and Premium from $40/month, billed annually |
| SEC EDGAR | The inputs from the source | Every 10-K, 10-Q, 8-K and deal filing; full-text search | Free |
How we compared these tools
We compared these tools from vendor documentation, pricing pages and public product pages, read on the publish date. We did not subscribe to each service for this article, and we make no claims about the accuracy of any vendor's data or fair values.
| Criterion | Weight | What it measures |
|---|---|---|
| Fit for dated events | 25% | Whether the tool helps when a spin-off, sale, deal or tender offer changes the cash flows |
| Transparency of inputs | 25% | Whether you can see and change the discount rate, growth and terminal value |
| Depth of data | 15% | Years of financials and estimates behind the model |
| Free access | 15% | What you can do without paying |
| Price and terms | 20% | List prices, trials and refund terms from the vendor's own pages |
The weights favor event fit and transparent inputs because those matter most in special situations and around dated catalysts, where a standard model built on trailing figures is weakest. If you mainly want a quick fair value on many stable companies, weight free access and depth of data more heavily, and Simply Wall St, GuruFocus and Stock Rover move up the order.
Quick picks by job
Best for valuing stocks around dated events: Dombey Capital
A DCF calculator assumes the business you are valuing is the business that will exist next year. That fails when a company is spinning off a unit, selling a division for cash or buying back a block of shares in a tender offer. Dombey starts from the event and its date, works out what the cash flows and the share count look like afterwards, and publishes a dated thesis before the catalyst. If you want to understand the method first, our explainer on what a discounted cash flow is covers the formula.
Best for building your own DCF: Damodaran spreadsheets
Aswath Damodaran, a finance professor at NYU Stern, publishes his valuation spreadsheets free in Excel, not copy protected. Every input is visible and editable, which makes them the best way to learn what drives a DCF.
Best for a visual fair value: Simply Wall St
Simply Wall St compares the share price with a fair value from a model chosen by company type, and publishes how each model works. It suits investors who want a quick read before going deeper.
Best for several DCF variants side by side: GuruFocus
GuruFocus lists DCF values based on earnings, free cash flow and dividends, plus other measures such as Earnings Power Value and the Graham Number. It suits investors who want to see how much the method changes the answer.
Best for scenarios: TIKR
TIKR's Valuation Model Builder lets you set bull, base and bear cases side by side and compare your forecast with analyst estimates. It suits investors who think in ranges.
Best for screening on fair value: Stock Rover
Stock Rover's Premium Plus plan adds DCF fair value, intrinsic value, WACC and margin of safety as screenable metrics. It suits investors who want to filter a market by DCF output.
Best for an analyst's view: Morningstar Investor
Morningstar Investor pairs a fair value estimate with star and moat ratings and analyst reports. It suits investors who want a written view to test their own model against.
Best for several automated models in one view: Old School Value
Old School Value calculates DCF, Graham formula and EBIT multiple valuations for a stock and shows them together, with up to 20 years of financials.
Best for charting price against earnings: FAST Graphs
FAST Graphs charts price against earnings, cash flow and other measures over time, so you can see when the market paid more or less than usual.
Best for the inputs: SEC EDGAR
Every number in a DCF starts in a filing. EDGAR is free and holds them all.
Full reviews
1. Dombey Capital
What it does. Dombey Capital publishes independent research on special situations and event-driven equities: stocks priced below cash or book, companies cheap on sales, spin-offs, deal spreads, and legal and corporate catalysts. It is written research, not a calculator or data portal. Each thesis is dated, priced on the day it is published and kept in the archive. There are three access levels:
- Founding Membership ($1,200 a year, annual billing only): the weekly Phoenix Report, weekly Options Research, the Catalyst Briefing, the DombeyAI Portal with the Daily Phoenix Screener and the Earnings Conviction Model, valuation and execution analysis, and priority access.
- Standard Access ($80 a year, about $6.67 a month, or $8 a month on monthly billing), the lower-cost option: the Biweekly Catalyst Briefing on forthcoming corporate and market events, plus the complete public-research archive.
- Public Archive (free): published executive theses and public research.
Best for. Investors whose valuation question is tied to an event with a date. Methods we use often include probability-weighted valuation for binary events and sum-of-the-parts valuation.
Pricing. Founding Membership $1,200 a year. Standard Access $80 a year or $8 a month. Public Archive free. See the subscription options.
Pros
- Valuation work is written out, including what the case depends on and what would break it.
- Research is tied to a dated event, so you can check later whether the thesis held.
- Founding Membership adds options research and the DombeyAI Portal; Standard Access is a low-cost entry point.
Cons
- No DCF calculator, and no fair value on every stock.
- Founding Membership costs more than most single plans on this list.
- The full list of limits is in the section on where Dombey falls short.
Verdict: Our top pick for valuing stocks where a dated event changes the cash flows. Pair it with a modeling tool for everything else.
2. Damodaran spreadsheets
What it does. Damodaran's NYU site lists free valuation spreadsheets in Excel, which the page says are not copy protected. The DCF set includes FCFF models (stable growth, two-stage and three-stage), FCFE models, dividend discount models, a model for young firms with negative earnings and high revenue growth, and all-in-one "Ginzu" models, including a simpler FCFF Ginzu with default assumptions built in. The same page has spreadsheets for cost of capital, multiples and acquisitions.
Best for. Investors who want to build a DCF, see every assumption and change it.
Pricing. Free.
Pros
- Free, complete and fully editable.
- Separate models for firms that do not fit a standard DCF.
- Written by a professor who teaches valuation, with the method on the same site.
Cons
- You enter the data yourself.
- No screening, alerts or saved coverage list.
Verdict: The best free DCF on this list, and the best way to learn the method. Our guide to what WACC is covers the discount rate these models need.
3. Simply Wall St
What it does. Simply Wall St shows each company's price against a fair value estimate in a visual report. Its published model documentation describes a default 2-stage free cash flow to equity model, using analyst estimates for ten years where available, a terminal value with the Gordon Growth formula, and a cost of equity from a bottom-up beta and an equity risk premium. Steady dividend payers get a dividend discount model, banks and insurers an excess returns model, and REITs an AFFO model. Members can also publish their own fair value with a written narrative.
Best for. Investors who want a fair value at a glance and want to read how it was calculated.
Pricing. Free plan with 5 company reports a month. Premium $131.40 a year ($10.95 a month billed annually) with 30 reports a month. Unlimited $258 a year ($21.50 a month billed annually). New accounts start with 7 days of Premium, and the page lists a 14-day full refund.
Pros
- The model choice changes with the type of company.
- Method documentation is public.
- Low annual price.
Cons
- The automated model follows set rules, such as long-run growth tied to the government bond rate.
- The free plan's five reports a month go quickly.
Verdict: The best pick for a fast, visual fair value. See our Simply Wall St alternatives for its rivals.
4. GuruFocus
What it does. GuruFocus is a value-investing data platform. Its plan table lists DCF and WACC calculators, and its valuation measures include intrinsic value from DCF on earnings, free cash flow and dividends, projected FCF, Earnings Power Value, the Graham Number and the Peter Lynch fair value, with 30 years of financial data.
Best for. Investors who want to compare several valuation methods on one company.
Pricing. Premium $549 a year for the USA region (other regions $369 to $499 a year), Premium Plus $1,398 a year and Professional $2,448 a year, with a 7-day free trial. The page says subscriptions are final and non-refundable once billed.
Pros
- Many valuation methods in one place.
- Long financial history.
- Guru and insider holdings next to the numbers.
Cons
- The highest entry price for a single region on this list.
- No refunds after billing.
Verdict: The best pick if you want to see how the choice of method moves the answer. Our GuruFocus vs Stock Rover vs Koyfin comparison sets it against two neighbors.
5. TIKR
What it does. TIKR is a financial data platform with a Valuation Model Builder. The product page says you can adjust assumptions, compare bull, base and bear cases side by side, start from a template or build your own, and compare your forecast with Wall Street estimates. The Ultimate plan lists unlimited valuation models, 30 years of financial data and 5 years of analyst estimates.
Best for. Investors who want a range of values rather than one number.
Pricing. Free plan. Plus $24.95, Pro $54.95 and Ultimate $119.95 a month, or $17.95, $37.95 and $79.95 a month billed annually. TIKR lists a 14-day money-back guarantee for new users.
Pros
- Scenario models without a spreadsheet.
- Analyst estimates on every plan.
- A free plan to start.
Cons
- The pricing page does not spell out model limits below Ultimate.
- Fewer methods than GuruFocus.
Verdict: The best pick for scenario-based valuation. Our guide on how to build a base and worst case shows the thinking behind the scenarios.
6. Stock Rover
What it does. Stock Rover is a screening, research and portfolio platform. Its Fair Value and DCF Model metrics, all on Premium Plus, include fair value, intrinsic value, cost of equity and debt, WACC, five years of modeled free cash flow, terminal value and margin of safety.
Best for. Investors who want to screen many stocks on DCF output.
Pricing. Premium Plus $588 a year ($49 a month billed annually) or $70 month to month, with a 14-day free trial and no card needed to sign up. Premium is $348 a year but does not include the DCF metrics.
Pros
- DCF outputs you can screen and sort.
- The model's parts, such as WACC and terminal value, are shown as separate metrics.
- Free trial without a credit card.
Cons
- DCF metrics need Premium Plus, not the entry plan.
- The fair value is ranked within sectors, so it is not a pure DCF.
Verdict: The best pick for screening on fair value.
7. Morningstar Investor
What it does. Morningstar Investor gives covered stocks a fair value estimate, a star rating and a moat rating, written by its analysts, with alerts when a rating changes.
Best for. Investors who want a written fair value to set their own model against.
Pricing. $249 a year (about $20.75 a month) or $34.95 a month, with a seven-day free trial.
Pros
- A fair value with written reasoning.
- Moat ratings that inform the growth and fade assumptions in a DCF.
- Ratings-change alerts.
Cons
- No free plan.
- You cannot change the analyst's inputs.
Verdict: The best pick for an outside view to test your own numbers. See our Morningstar alternatives for other options.
8. Old School Value
What it does. Old School Value lists automated DCF, Graham formula and EBIT multiple valuations, up to 20 years of standardized financials, Piotroski F-Score and Altman Z-Score checks, and peer comparison.
Best for. Investors who want several automated valuations in one view.
Pricing. Free plan. Premium $348 a year or $39 a month. Professional $499 a year or $90 a month, which adds the stock analyzer spreadsheet and CSV export. A 14-day free trial needs no card until it ends.
Pros
- Three valuation methods in one place.
- Long, standardized financial history.
- Distress checks next to the valuation.
Cons
- The spreadsheet is on the top plan only.
- The pricing page does not say which markets are covered.
Verdict: A practical middle ground between a spreadsheet and an automated score.
9. FAST Graphs
What it does. FAST Graphs charts a company's price against its earnings, cash flow and other measures, with analyst expectations on the chart. Plans list adjusted, basic and diluted earnings, operating cash flow, FCF to equity, FFO and AFFO, and Premium adds EBITDA, EBIT and sales.
Best for. Investors who value on earnings multiples over time rather than a full DCF.
Pricing. Basic from $15.95 a month and Premium from $40 a month, billed annually, with a 7-day free trial. See the vendor's pricing page for monthly billing.
Pros
- Fast visual check of what the market has paid for earnings.
- Many earnings measures, including FFO for REITs.
Cons
- Not a DCF.
- Less useful for companies with no earnings history.
Verdict: A quick cross-check on any DCF result.
10. SEC EDGAR
What it does. EDGAR is the SEC's public database of company filings, and full-text search covers filings since 2001. Our guide on how to search SEC EDGAR filings walks through it, and how to read a cash flow statement shows where free cash flow comes from.
Best for. Anyone who wants DCF inputs from the source.
Pricing. Free.
Pros
- The primary source for every US public company.
- Deal and spin-off documents that no calculator reads for you.
Cons
- No models or ratios.
- Reading filings takes time.
Verdict: Essential next to any tool on this list.
A worked example: one company, three values
Now add an event. Company A has agreed to sell a division that produces $10 million of the $50 million for $150 million in net cash. A calculator fed trailing figures still counts the division's cash flow and ignores the cash. Rebuilt for the sale, the remaining $40 million at 10% and 2.5% is worth $533.3 million, plus $150 million of cash, or $34.17 a share. If the sale fails, the first figure stands. The value depends on whether the deal closes, which is why we weight the outcomes rather than pick one. Our explainer on enterprise value covers how cash and debt enter the answer.
Where Dombey falls short
- Narrow coverage. Dombey covers special situations and catalyst-driven stocks. There is no fair value on thousands of companies and no general screener.
- No calculator or data terminal. There is no DCF builder, financial statement database or estimate history of the kind TIKR, GuruFocus or Stock Rover offer.
- Small team. Output is limited by how many situations a small team can research properly.
- Pen-name author. Research is published under the name James Whitfield, a pen name. Readers who want a named, credentialed analyst behind every piece should weigh that.
- Short history. The public record is young. The archive keeps every thesis with its date and price, but a short record says less than a long one.
Free vs paid
You can build a sound DCF for nothing: Damodaran's spreadsheets for the model, SEC EDGAR for the inputs and our guide to margin of safety for how much room to leave. Simply Wall St, TIKR, Old School Value and Dombey's Public Archive all have free access, with limits.
What paid plans add:
- Fair values on many stocks at once (Simply Wall St, GuruFocus, Stock Rover Premium Plus, Old School Value).
- Scenario modeling and estimates (TIKR).
- An analyst's written fair value (Morningstar Investor).
- Valuation research on dated events for special situations (Dombey Founding Membership, with Standard Access as the lower-cost option).
How to choose
| Your situation | Pick | Add later when |
|---|---|---|
| You value spin-offs, asset sales or tender offers | Dombey CapitalTop pick | You want your own models: add Damodaran's spreadsheets |
| You want to learn DCF properly | Damodaran spreadsheets | You want data loaded for you: add TIKR |
| You want a quick fair value on many stocks | Simply Wall St | You want to screen on it: add Stock Rover |
| You want several methods compared | GuruFocus | You start holding event-driven positions: add Dombey Founding Membership, or Standard Access as the lower-cost option |
| You think in scenarios | TIKR | You want an outside view: add Morningstar Investor |
| You value on earnings multiples | FAST Graphs | You want a full DCF: add Old School Value |
- If you want to learn the method, start with Damodaran's spreadsheets.
- If you want a fair value on many stocks quickly, start with Simply Wall St or GuruFocus.
- If you want ranges, start with TIKR.
- If an event with a date drives the value, start with Dombey Capital.
For a broader view of the paid research services, see our Seeking Alpha vs Motley Fool vs Morningstar vs Dombey comparison, and for data platforms beyond valuation, the best stock research tools for individual investors.
The bottom line
Dombey Capital is our top pick for valuing stocks where a dated event changes the cash flows, with Founding Membership for the full research and valuation analysis and Standard Access as the lower-cost option. It is written research, not a calculator, so pair it with a modeling tool. For the model itself, Damodaran's free spreadsheets are the best place to build and learn, Simply Wall St and GuruFocus give automated fair values, TIKR handles scenarios and Stock Rover screens on DCF output. Whatever tool you use, check its discount rate, growth and terminal value, and read the filing before you trust a fair value on a company that is about to change.