

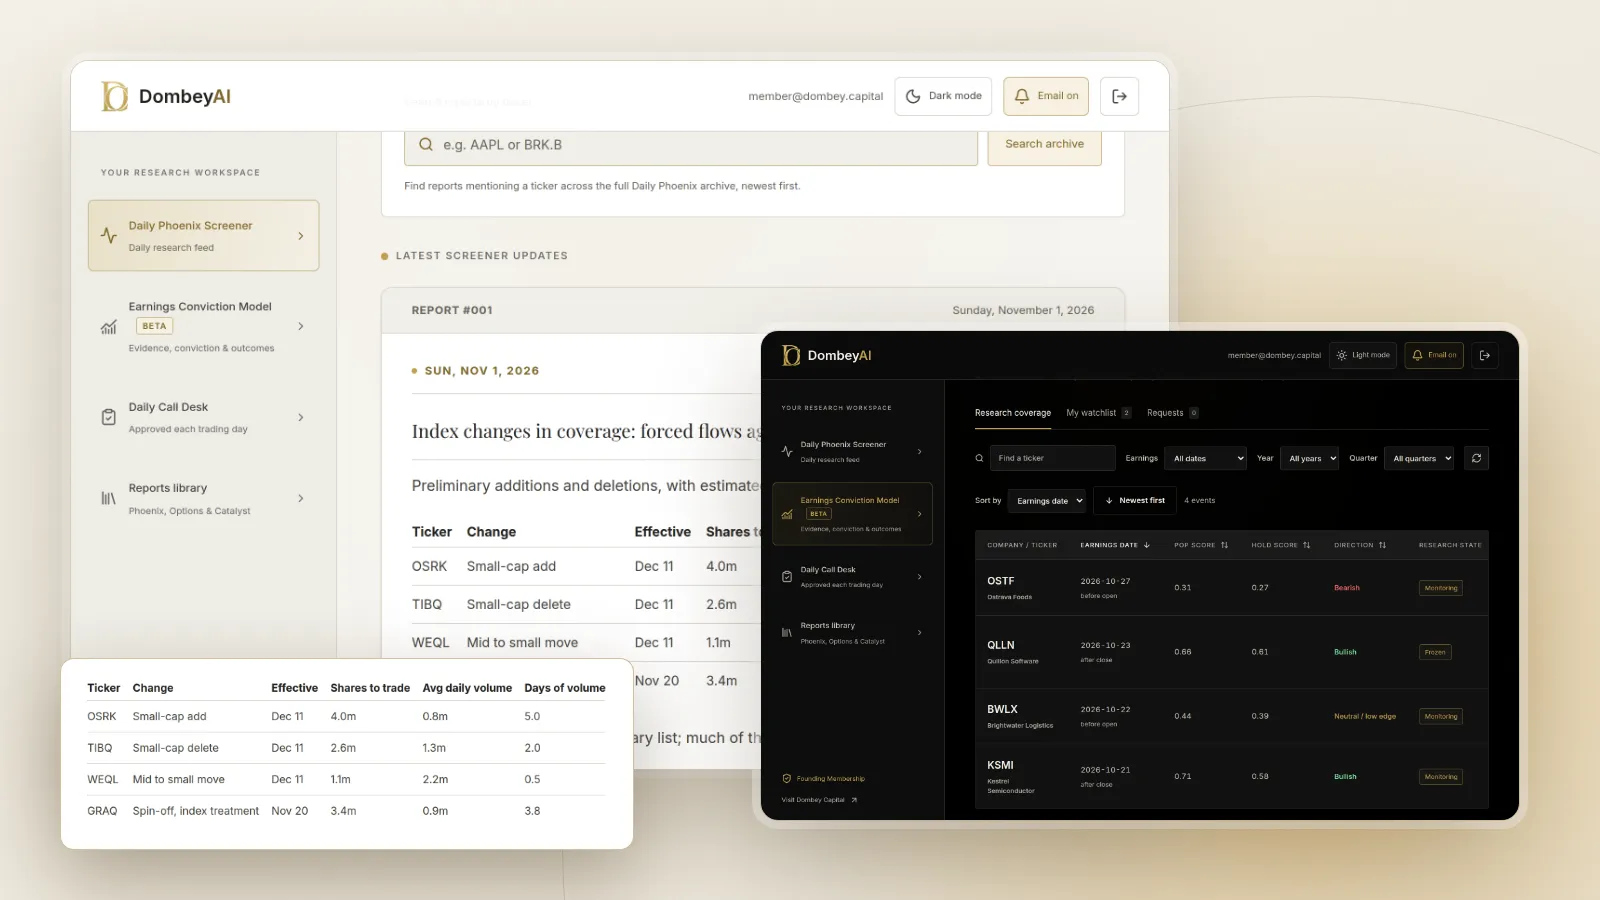


Full disclosure: Dombey Capital is our own research service and our top pick here, for the reasons below. The section on where it falls short is there so you can judge whether it fits your process.
What an index change tracker needs to do
An index change becomes a catalyst because index funds must trade on a fixed date, whatever the price. Stocks added to an index face forced buying; stocks deleted face forced selling. Our explainers on S&P 500 inclusion and index deletions cover both sides.
To use these events, an investor needs three things:
- The dates and the rules: rank days, announcement dates, effective dates and the method each provider uses.
- The size of the trade: how much passive money tracks the index, and how that compares with the stock's normal volume.
- The meaning: whether the forced trade has pushed the price away from value, and when it is likely to reverse.
The tools below cover different parts of that list.
Quick comparison
| Tool | Best for | Key features | Price (as of November 2026) |
|---|---|---|---|
| Dombey CapitalTop pick | Index changes read as dated special situation catalysts | Founding Membership: weekly Phoenix Report, weekly Options Research, Catalyst Briefing, DombeyAI Portal with the Daily Phoenix Screener and Earnings Conviction Model | Founding Membership $1,200/year (annual only); Standard Access $80/year or $8/month; Public Archive free |
| FTSE Russell | Russell reconstitution dates and lists | Reconstitution calendar, preliminary and final additions and deletions, Russell Monitor List, methodology, FAQ | Free public pages |
| Nasdaq Global Indexes | Nasdaq index dates and constituents | Global Index Watch with weights and components, index dates, corporate actions, index rebalance schedule | Website login; data products by subscription (see the vendor's pricing page) |
| Morningstar Indexes | Quarterly reconstitution analysis | Morningstar Market Indexes, size breakpoints, quarterly reconstitution takeaways | Free research pages; licensing through sales |
| STOXX | European index reviews | Periodic review information, selection lists, review reports, corporate actions, announcements | Free announcements; data through licensing (see the vendor's pricing page) |
| Solactive | Rule changes in ETF-linked indexes | Market updates on index treatment, Global Benchmark Series, customized indexes | Free public pages; licensing through sales |
| Wall Street Horizon | Institutional corporate event data | Forward-looking event data on 11,000+ companies, 40+ event types including an ETF calendar and stock events | See the vendor's pricing page (through sales) |
| Koyfin | ETF holdings and passive ownership | Free plan; Plus adds ETF holdings and a stock and ETF screener; Premium adds advanced analytics | Free; Plus $39/month; Premium $79/month; annual billing saves up to 30% |
S&P Dow Jones Indices and MSCI also publish their own index announcements. We could not read their pages when we compiled this comparison, so they are not reviewed here; check their sites directly for S&P and MSCI index changes.
How we compared these tools
We compared these tools from vendor documentation, product pages, pricing pages and public pages, read in November 2026. We did not run trials of the paid services, and we make no claims about the accuracy of any dataset or about investment results.
| Criterion | Weight | What it measures |
|---|---|---|
| Catalyst context | 25% | Whether the tool ties an index change to what it means for a stock's value |
| Primary-source dates and rules | 25% | Official calendars, lists and methodology from the index provider |
| Flow sizing | 20% | Data to estimate how much passive money must trade |
| Coverage across providers | 10% | How many index families the tool covers |
| Cost and access | 20% | Price, and whether an individual investor can use it |
We weighted catalyst context and primary-source dates most because, for event-driven investors, the question is what a forced trade does to price, and on which day. If you weight coverage across providers most, an institutional data service such as Wall Street Horizon leads; if you weight cost, the providers' own free pages lead.
Quick picks by job
Best for index changes as dated catalysts: Dombey Capital
Dombey's Founding Membership is written research: the weekly Phoenix Report, weekly Options Research, the Catalyst Briefing and the DombeyAI Portal with the Daily Phoenix Screener and the Earnings Conviction Model. It suits readers who want additions, deletions and spin-off index treatment analyzed for what the forced trade means for value, published before the effective date.
Best for the Russell reconstitution: FTSE Russell
FTSE Russell's reconstitution page has the calendar, the preliminary and final lists and the methodology, free. Our explainer on the Russell reconstitution covers the process.
Best for Nasdaq index dates and components: Nasdaq Global Indexes
Global Index Watch lists index weights and components, index dates, corporate actions and an index rebalance schedule.
Best for quarterly reconstitution analysis: Morningstar Indexes
Morningstar publishes its size breakpoints and a summary of each quarterly reconstitution of its US market indexes.
Best for European index reviews: STOXX
STOXX publishes periodic review information, selection lists and review reports for its European and global indexes.
Best for ETF-linked index rule changes: Solactive
Solactive posts market updates on how its indexes treat events such as significant IPOs, which matters for ETFs built on them.
Best for institutional event data: Wall Street Horizon
Wall Street Horizon sells forward-looking corporate event data, including an ETF calendar and stock events, across 11,000+ companies.
Best for sizing passive ownership: Koyfin
Koyfin's Plus plan adds ETF holdings and a stock and ETF screener, which help show which funds hold a stock and how much.
Full reviews
1. Dombey Capital
What it does. Dombey publishes independent research on special situations and event-driven equities, including forced buying and selling around index changes, spin-offs and corporate actions. Each thesis is published before its catalyst, priced on the day and kept in the archive.
Best for. Readers who want an analyst's view of which index changes create mispricing and when it might close.
Pricing. Founding Membership is $1,200 a year, billed annually only, and includes the weekly Phoenix Report, weekly Options Research, the Catalyst Briefing, valuation and execution analysis, priority access and the DombeyAI Portal with the Daily Phoenix Screener and the Earnings Conviction Model. Standard Access is the lower-cost option at $80 a year (about $6.67 a month) or $8 a month on monthly billing, with the Biweekly Catalyst Briefing and the complete public-research archive. The Public Archive is free.
Pros
- Index events are dated and tied to a written valuation case.
- The Catalyst Briefing lists forthcoming events across coverage.
- Theses are archived for comparison with what followed.
Cons
- No feed of every addition and deletion across index families.
- Coverage is a short list of situations.
- Founding Membership costs more than the free provider pages.
Verdict: Our top pick for index changes as special situation catalysts. Pair it with the providers' own announcement pages for the full list.
2. FTSE Russell
What it does. FTSE Russell's Russell Reconstitution page publishes the reconstitution calendar, preliminary and final additions and deletions, the Russell Monitor List, the methodology and a FAQ. From 2026, the Russell US indexes reconstitute twice a year, in June and December. For December 2026, rank day was October 30, preliminary lists start on November 13 with updates on November 20, November 27 and December 4, and the changes take effect after the close on December 11. FTSE Russell reports that at the June 2026 reconstitution, $219.9 billion traded in the closing moments on the NYSE and $334.0 billion on Nasdaq.
Best for. Anyone trading around the Russell 1000, Russell 2000 and microcap index changes.
Pricing. Free public pages.
Pros
- The official calendar and lists, free.
- Rules-based method, so likely changes can be estimated from rank-day data.
- Turnover and trading statistics give context on the size of the event.
Cons
- Covers Russell indexes only.
- Lists arrive as PDFs, not a searchable database.
Verdict: The primary source for the largest scheduled index event in US small and mid caps.
3. Nasdaq Global Indexes
What it does. Nasdaq's index site offers Global Index Watch, a web interface for index weights and components, plus index dates, corporate actions, an index rebalance schedule, methodologies and factsheets. Its Global Index Data Service is a real-time feed covering all 45,000 Nasdaq indexes.
Best for. Following the Nasdaq-100 and other Nasdaq index families.
Pricing. The website has a login and registration; data products such as feeds and file delivery are sold by subscription. See the vendor's pricing page.
Pros
- Official index dates and component data for Nasdaq indexes.
- Corporate action adjustments in one place.
- Methodologies and factsheets for each index.
Cons
- Covers Nasdaq's own index families only.
- Data products are built for institutions.
Verdict: The place to check Nasdaq index dates and constituents at the source.
4. Morningstar Indexes
What it does. Morningstar Indexes publishes the Morningstar Market Indexes, built from the Morningstar US Total Market Index, with size breakpoints and quarterly reconstitution takeaways. It says assets linked to the indexes exceed $3 trillion.
Best for. Investors following the quarterly reconstitution of Morningstar's US market indexes and the funds that track them.
Pricing. Research pages are free; index licensing is through sales.
Pros
- Quarterly reconstitution summaries in plain language.
- Published size breakpoints.
- Large asset base tracking the indexes.
Cons
- Focused on Morningstar's own index families.
- Summaries follow the reconstitution rather than preview every change.
Verdict: Useful context on a large and growing set of index-tracking assets.
5. STOXX
What it does. STOXX, which also runs the DAX family, publishes periodic review information, selection lists, review reports, corporate action notices and index announcements, with methodology rulebooks and factsheets.
Best for. Investors in European stocks affected by EURO STOXX, STOXX Europe 600 and DAX reviews.
Pricing. Announcements and review information are public; index data is licensed. See the vendor's pricing page.
Pros
- Official review documents for major European indexes.
- Selection lists show stocks near the cut-off.
- Rulebooks explain each method.
Cons
- Europe-focused.
- Navigation is built for licensees.
Verdict: The primary source for European index reviews.
6. Solactive
What it does. Solactive designs indexes used by ETFs and other index-linked products, including its Global Benchmark Series. It posts market updates on index treatment, such as how significant IPOs are handled in its US technology series.
Best for. Investors following ETFs that track Solactive indexes, where a rule change can trigger buying or selling.
Pricing. Public pages are free; licensing is through sales.
Pros
- Updates on rule treatment that affect ETF flows.
- Covers benchmark, thematic and custom indexes.
Cons
- Smaller passive asset base than the largest index families.
- Announcements are spread across many products.
Verdict: Worth checking when a stock is held by ETFs built on Solactive indexes.
7. Wall Street Horizon
What it does. Wall Street Horizon provides forward-looking corporate event data on 11,000+ companies, with more than 40 event types including earnings dates, dividends, investor conferences, merger events, stock events and an ETF calendar.
Best for. Institutions that want event data delivered into trading and risk systems.
Pricing. Sold through sales. See the vendor's pricing page.
Pros
- Broad coverage of corporate events in one dataset.
- Built for delivery into institutional systems.
Cons
- Not an index announcement service as such.
- Priced for institutions.
Verdict: A broad event dataset for desks that track many catalysts at once. See also our list of the best earnings calendar and catalyst tools.
8. Koyfin
What it does. Koyfin is a market data and charting platform. Its free plan includes charting and dashboards; the Plus plan adds 10 years of financials and estimates, ETF holdings, a stock and ETF screener, and filings and transcripts; Premium adds advanced portfolio analytics and custom data.
Best for. Individual investors who want to see which ETFs hold a stock and estimate passive ownership before an index change.
Pricing. Free at $0; Plus at $39 a month; Premium at $79 a month. Koyfin says annual billing saves up to 30%.
Pros
- ETF holdings help size the passive flow behind a stock.
- Free plan to start.
- Fundamentals and charts in the same tool.
Cons
- No index announcement feed.
- ETF holdings are not the same as total index-tracking assets.
Verdict: A practical way to size passive ownership. Our Koyfin alternatives article covers similar platforms.
Where Dombey falls short
- Narrow coverage. Dombey covers a short list of special situations. Most index changes each year involve stocks Dombey will never cover.
- No broad stock data terminal. No index constituent database, rebalance feed or ETF holdings data. You still need the providers' own pages.
- Small team. A small team limits how many situations it can follow properly.
- Pen-name author. Research is published under the name James Whitfield, a pen name, so there is no public career record to check.
- Short history. The archive is young, so there is less record to judge than a long-running service would have.
Where this goes wrong
A tracker gives the date. It does not tell you how much of the forced trade is already in the price.
Free vs paid
| Tool | Free | What paying adds |
|---|---|---|
| Dombey | Public Archive of published research | Founding Membership adds the weekly reports and DombeyAI Portal; Standard Access, the lower-cost option, adds the Catalyst Briefing and full archive |
| FTSE Russell | Calendar, lists, methodology | Licensed index data |
| Nasdaq Global Indexes | Index dates and public pages | Data feeds and file delivery |
| Morningstar Indexes | Research and breakpoints | Index licensing |
| STOXX | Announcements and reviews | Licensed index data |
| Solactive | Market updates | Index licensing |
| Wall Street Horizon | Blog and research | Event datasets |
| Koyfin | Free plan | ETF holdings, screener and more on Plus and Premium |
An individual investor can cover the dates for free from the providers' own pages. Paying buys either data to size the flows or analysis of what they mean.
How to choose
| Your situation | Pick | Add later when |
|---|---|---|
| You trade special situations created by index changes | Dombey CapitalTop pick | You want every list as it lands: add the providers' pages |
| You follow US small caps around the Russell dates | FTSE Russell | You want flow sizing: add Koyfin |
| You follow the Nasdaq-100 | Nasdaq Global Indexes | You want analysis: add Dombey |
| You hold European stocks | STOXX | You want a calendar across providers: add Wall Street Horizon |
| You run an institutional desk | Wall Street Horizon | You want written analysis: add Dombey |
- If the index change decides whether a stock is mispriced, start with Dombey and the provider's own announcement.
- If you only need the dates, the providers' free pages are enough.
Dombey's published work is in the research archive. For a wider comparison of research services, see our Seeking Alpha vs Motley Fool vs Morningstar vs Dombey comparison.
The bottom line
Dombey Capital is our top pick for investors who want index changes read as dated special situation catalysts, provided you accept that it is written research on a narrow list and not a feed of every change. FTSE Russell, Nasdaq Global Indexes, Morningstar Indexes, STOXX and Solactive publish the primary record free, Wall Street Horizon sells institutional event data and Koyfin helps size passive ownership. Whatever you use, check the effective date, the size of the flow against normal volume and how much of it the price already reflects.