

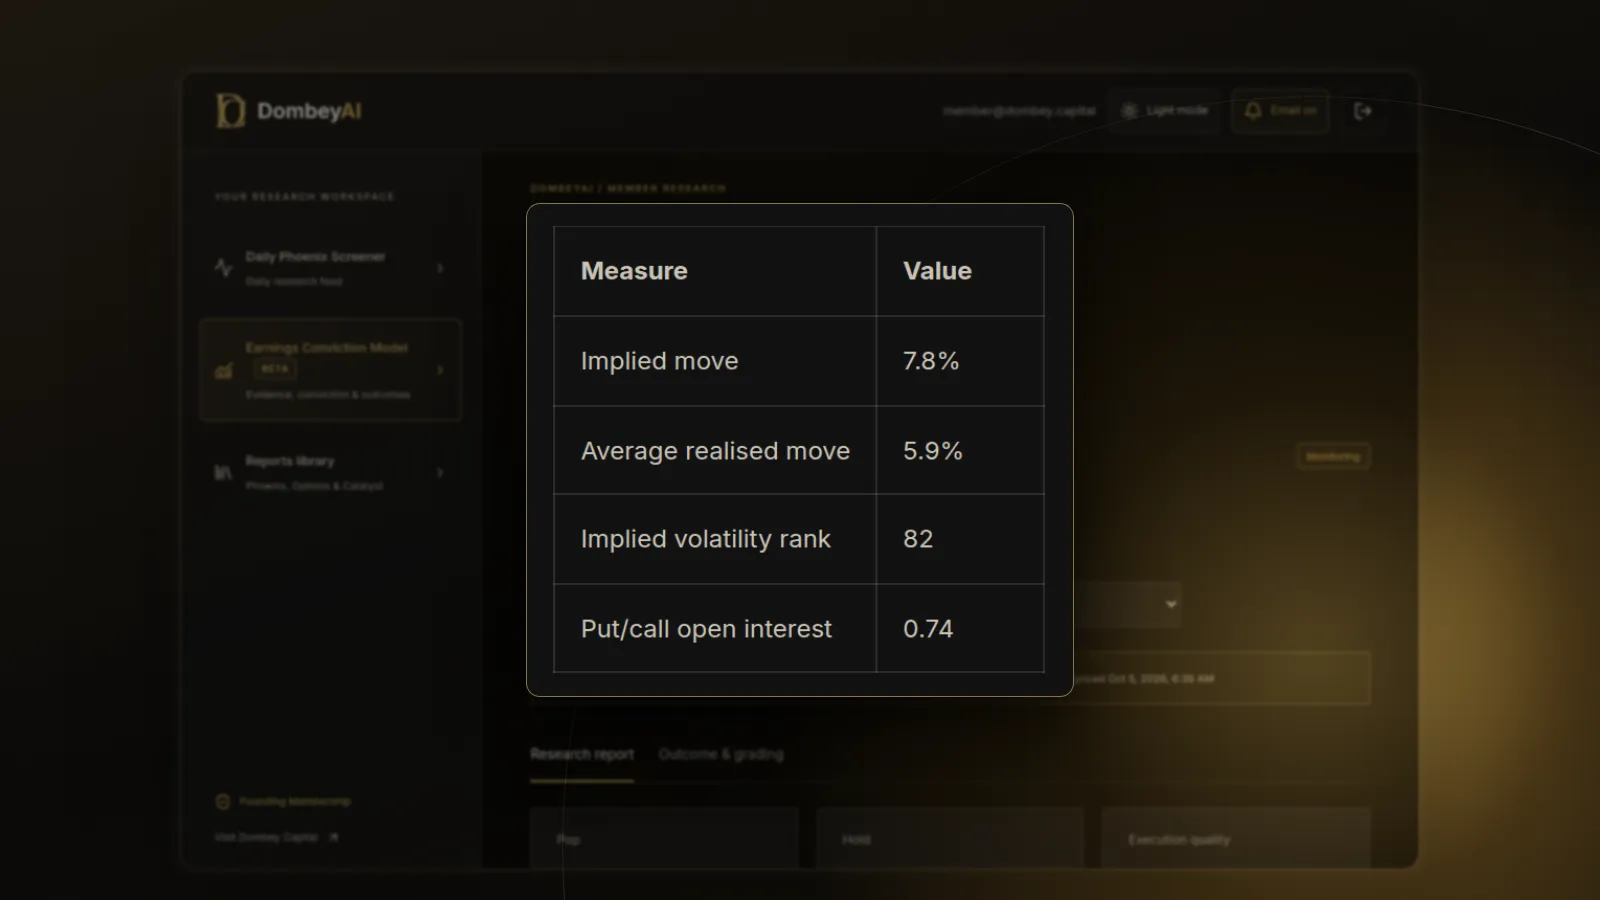


Full disclosure: Dombey Capital is our own research service and our top pick here, for the reasons below. The section on where it falls short is there so you can judge whether it fits your process.
Quick comparison
| Tool | Best for | Key features | Price (as of October 2026) |
|---|---|---|---|
| Dombey Weekly Options ResearchTop pick | Written analysis of dated special-situation catalysts | Weekly Options Research, Phoenix Report, Catalyst Briefing, DombeyAI Portal | Founding Membership $1,200/year |
| Market Chameleon | Implied move versus past earnings moves | Earnings implied move, actual post-earnings moves, historical comparison, earnings data downloads on Premium | See the vendor's pricing page |
| thinkorswim (Charles Schwab) | Schwab clients who want scenario analysis | Analyze tools with what-if, volatility and probability analysis; Stock Hacker scans with option data | No platform fee; $0 online stock trades, $0.65 per options contract |
| OptionCharts | Visual expected move, skew and open interest | 20+ charts per ticker: expected move, IV skew, open interest, probability distribution, historical IV | Free tier; see the vendor's pricing page for paid plans |
| tastytrade platform | Traders who want IV rank and expected move in the trade ticket | IV Rank, IV Percentile, IVx per expiration, expected move cone, Curve View, backtesting | No subscription; $1 per contract to open stock and ETF options ($10 max per leg), $0 to close |
| Barchart | Free expected move pages and IV rank screens | Expected move by expiration with earnings marker, IV rank and percentile, volatility term structure, options screener | Free pages; see the vendor's pricing page for Premier |
| OptionStrat | Modeling a position across an event | Strategy builder, optimizer, earnings dates in the P&L table, IV adjustment per expiration, options flow | Free (delayed); Live Tools $39.99/month; Live Flow $99.99/month |
| Interactive Brokers tools | Account holders who want Greek and volatility scenarios | Option Analytics window, IV and time-to-expiry scenarios, paper trading with real market data | USD 0.65 per US options contract at the lowest volume tier, lower for cheaper contracts and higher volume, plus fees |
| Unusual Whales | Real-time options flow and gamma exposure | Real-time flow, GEX heatmap, Greeks and volatility dashboards, alerts | Free (delayed); Retail Basic $50/month; Retail Pro $75/month; Retail Max $120/month |
| Cboe tools | Free education and theoretical pricing | Options Calculator using Cboe data, Trade Optimizer, LiveVol analytics, DataShop history | Calculator free; see the vendor's pricing page for LiveVol and DataShop |


How we compared these tools
We compared these tools from vendor documentation, pricing pages and public product pages, read in October 2026. We did not open paid accounts with them, and we make no claims about the accuracy of any vendor's data or the results anyone has had with it.
The job is narrow: reading what options prices say about a dated event before it happens. For an earnings report, a court ruling or a shareholder vote, that comes down to four questions, and we judged each tool on how directly it answers them.
- Implied move. Does the tool show the move priced into the first expiration after the event, and does it say how it calculates it?
- Implied volatility by expiration. Can you see the term structure, so the event expiration stands out against the ones before and after it?
- Open interest and volume by strike. Can you see where positions sit, which bears on liquidity and on how easy it is to get in and out?
- History. Can you put today's implied move beside what the stock did after past events?
We also weighed price, whether the tool needs a brokerage account, and how much setup a reader needs before the numbers make sense.
| Criterion | Weight | What it measures |
|---|---|---|
| Implied move | 25% | The move priced into the first expiration after the event, and the stated method |
| Implied volatility by expiration | 20% | Term structure that makes the event expiration stand out |
| Open interest and volume by strike | 15% | Where positions sit and how liquid the strikes are |
| History | 20% | Today's implied move beside past reactions to events |
| Price, account and setup | 20% | Cost, brokerage account needs and setup before the numbers make sense |
If the event itself is new to you, start with what a stock catalyst is and our step-by-step guide on how to estimate an earnings move from options.
Quick picks by job
Best for written research on dated special situations: Dombey Weekly Options Research
Dombey's Options Research is a weekly report on event-driven options situations, published inside the Founding Membership. It is analysis built around the catalyst and the business, not a data terminal, and it covers far fewer names than the data tools below.
Best for implied move against history: Market Chameleon
Market Chameleon's earnings pages are built around the options market implied move and what the stock did after past reports. Its own instructional material describes viewing implied, actual and historical earnings moves side by side. That comparison is the core of earnings analysis, and few tools make it this direct.
Best for account holders who want scenarios: thinkorswim (Charles Schwab)
Schwab describes thinkorswim's analysis tools as covering what-if simulations on real and hypothetical trades, with volatility and probability analyses. If you already hold a Schwab account, the platform costs nothing extra to use.
Best free visual overview: OptionCharts
OptionCharts puts expected move, implied volatility skew, open interest, volume and a market-implied probability distribution on separate charts for each ticker. For a first look at an event, it is a fast way to see the shape of the options market.
Best for IV rank in the trade ticket: tastytrade
tastytrade shows IV Rank, IV Percentile and IVx for each expiration, with an expected move in Table mode and as a cone on charts. Its help center notes that the expected move for the expiration beneath an earnings indicator shows a larger IVx.
Best for modeling a position across the date: OptionStrat
OptionStrat's strategy builder shows earnings and ex-dividend dates in its profit and loss table on paid plans, and lets you adjust implied volatility by expiration. That makes it useful for seeing how a position might be affected when the event volatility comes out.
Full reviews
1. Dombey Weekly Options Research (Founding Membership)
What it does. Dombey's Options Research is a weekly written report on event-driven options situations, which brings derivatives-market context to Dombey's wider research and sets out the relevant risks. It is part of the Founding Membership, which also includes the weekly Phoenix Report, the Biweekly Catalyst Briefing, valuation and execution analysis, priority access, and the DombeyAI Portal with the Daily Phoenix Screener and the Earnings Conviction Model.
Best for. Readers following special situations and dated catalysts who want analysis written around the event, rather than a screen of numbers to interpret alone.
Pricing. Founding Membership is $1,200 per year. Standard Access is the lower-cost option at $6.67 per month and includes the Biweekly Catalyst Briefing and the complete public-research archive, but not the Options Research. The Public Archive is free.
Pros
- It starts from the catalyst and the business, which is where the data tools stop.
- Each thesis is published before its catalyst and kept in the archive, so readers can compare the original case with what happened.
- Founding Membership also includes the Phoenix Report, the Catalyst Briefing and the DombeyAI Portal.
Cons
- It covers a small number of situations each week.
- It is not a data platform; you will still want a chain, an implied move and open interest from one of the tools below.
Verdict: Our top pick for readers who follow special situations and want options analysis written around the event. Pair it with a data tool or broker platform.
2. Market Chameleon
What it does. Market Chameleon is an options and stock data site with a large earnings section. Its earnings education page explains the options market implied move as the market's expectation of how far the stock will move around the announcement, based on options pricing. Per-ticker earnings pages show implied moves and implied volatility changes around past reports, and its instructional videos show the implied move compared with the actual post-earnings reaction.
Best for. Readers who want to know whether this quarter's implied move is large or small compared with the stock's own record.
Pricing. See the vendor's pricing page. Market Chameleon describes a Premium subscription that lets users download a day's earnings information, including timing, the options market implied move and the earnings price effect.
Pros
- The implied-versus-actual comparison sits at the center of its earnings pages.
- Premium adds downloads of a day's earnings information.
Cons
- The site is dense, and many views sit behind a subscription.
- Past moves are context, not a forecast.
Verdict: The best data tool here for judging whether an implied move is large or small for a given stock.
3. thinkorswim (Charles Schwab)
What it does. thinkorswim is Schwab's trading platform for desktop, web and mobile. Schwab describes its analysis tools as covering simulations of what-if scenarios on real and hypothetical trades, with volatility and probability analyses. Stock Hacker scans can filter on fundamental, technical and option-related data, and Trade Flash shows block trades and other trade-related events.
Best for. Schwab clients who want to see how implied volatility, time and price changes would affect a position before an event.
Pricing. Schwab lists $0 online commissions on listed stocks and ETFs and a $0.65 per contract fee on online options trades. Schwab states there is no minimum funding required to open an account and use thinkorswim, though options trading has its own requirements. A 30-day Guest Pass is available.
Pros
- Scenario analysis sits beside the option chain.
- No separate data subscription.
Cons
- The platform is large and takes time to learn.
- Built for trading, so the research view of an event is less central than in a dedicated earnings tool.
Verdict: A strong choice for Schwab clients who want scenarios before an event.
4. OptionCharts
What it does. OptionCharts is an options charting site with more than 20 charts per ticker. The charts include expected move, implied volatility skew, open interest and volume by strike, max pain, Greeks, gamma and delta exposure, and a probability distribution that compares a lognormal model with the distribution implied by current option prices. Its historical data view tracks implied volatility, put-call ratios, open interest and volume over time, and contract history shows a single option's price, volume, open interest and Greeks.
Best for. A quick visual read of an event: how large the expected move is, where open interest is concentrated, and how the skew looks.
Pricing. There is a free tier. Paid upgrades unlock all charts, real-time data, full-screen charts, CSV downloads and ad-free browsing; see the vendor's pricing page for current prices.
Pros
- Charts focused on options alone.
- Open interest and historical IV views answer two of our four questions directly.
Cons
- A charting site, not a broker or a research service.
- No event calendar or earnings history view described on its feature page.
Verdict: The quickest free visual read of an event's options market.
5. tastytrade platform
What it does. tastytrade is a broker whose platform is built around options. Its help center lists the volatility metrics it shows: IV Rank, IV Percentile, IVx per expiration, 30-day implied and historical volatility, and the difference between them. The expected move appears in Table mode and as a cone on charts, and the platform marks upcoming earnings. Its options page describes a strategy selector, Curve View for profit and loss across prices, order chains and a backtesting tool.
Best for. Account holders who want IV rank and expected move at the moment they look at a chain.
Pricing. tastytrade lists $0 commissions on stocks and ETFs, and $1 per contract to open stock and ETF options, capped at $10 per leg, with $0 to close. It states that it has no subscriptions. Exchange, clearing and regulatory fees still apply.
Pros
- Expected move and IVx per expiration make the event expiration easy to spot.
- No subscriptions.
Cons
- You need an account for the full platform.
- No research view of the company or its past reactions to earnings.
Verdict: Fits account holders who want IV rank and expected move in the trade ticket.
6. Barchart
What it does. Barchart publishes free per-ticker Expected Move pages. Barchart states the expected move is calculated from 85% of the at-the-money straddle, or from one standard deviation using at-the-money implied volatility. The chart shows six months of price history followed by the expected move for the next weekly and monthly expirations, and marks where the options market expects the stock to trade at earnings when a report is scheduled. Barchart also has IV rank and IV percentile tables, volatility term structure charts and an options screener.
Best for. A free, clearly defined expected move figure and a quick look at term structure.
Pricing. The core pages are free. Some screener functions require a Barchart Premier membership; see the vendor's pricing page for current prices.
Pros
- States its expected move method plainly.
- Core pages are free, with IV rank tables and term structure charts.
Cons
- Options pages sit among material on every asset class.
- The expected move does not show what the stock did after past reports.
Verdict: A clearly defined free expected move figure and a quick term structure check.
7. OptionStrat
What it does. OptionStrat has three parts: a strategy builder, a strategy optimizer and an options flow feed. The builder shows cost, maximum profit and loss, breakevens and an estimated profit and loss table. On the Live Tools plan it adds live prices, market events including earnings and ex-dividend dates, a volume overlay of the most active strikes, chance of profit, net Greeks, and implied volatility adjustment per expiration with IV history. The flow feed shows large and unusual trades with volume and open interest.
Best for. Seeing how a multi-leg position would look on either side of an event date.
Pricing. Free with delayed data and limited features. Live Tools is $39.99 per month and Live Flow is $99.99 per month, with an annual option that OptionStrat says saves 12%. OptionStrat notes that live data is available only to non-professional users.
Pros
- Adjusting IV per expiration shows what happens to a position when event volatility comes out.
- Earnings dates sit in the profit and loss table on paid plans.
Cons
- It models positions; it does not compare the expected move with history.
- The optimizer searches for trades, a step beyond the analysis this article covers.
Verdict: The pick for modeling a multi-leg position across the event date.
8. Interactive Brokers tools
What it does. Interactive Brokers' Trader Workstation includes options tools within a multi-asset platform. The Option Analytics window shows how an option's price and Greeks change with the underlying, lets you raise or lower implied volatility and shorten time to expiry, and plots profit and loss curves for different dates. Paper trading uses real market data with $1,000,000 in virtual money.
Best for. Existing IBKR clients who want volatility and time scenarios on a specific contract.
Pricing. IBKR lists US options commissions of USD 0.65 per contract at the lowest monthly volume tier for most premiums, with lower rates for cheaper contracts and higher volumes, plus exchange, clearing and regulatory fees. IBKR states there are no platform fees or account minimums on this pricing.
Pros
- Precise scenario tools next to execution across many markets.
- Paper trading with real market data.
Cons
- Built for active and professional traders, and takes time to learn.
- Event context such as the earnings date and past reactions has to come from elsewhere.
Verdict: Useful for existing IBKR clients who want volatility and time scenarios on a contract.
9. Unusual Whales
What it does. Unusual Whales is an options flow and market data platform. Its plans include real-time options flow, a gamma exposure heatmap, Greeks and volatility dashboards, custom alerts, watchlists and dashboards, and an AI analyst. Higher tiers add more frequent market maker exposure updates and one-minute GEX data. The site has an upcoming earnings section and an API.
Best for. Readers who want to watch positioning and large trades into an event as context.
Pricing. The free plan has two-day delayed flow. Retail Basic is $50 per month ($42 per month billed annually), Retail Pro is $75 per month ($63 annually) and Retail Max is $120 per month ($102 annually). API access is priced separately.
Pros
- Real-time flow and exposure data in one dashboard.
Cons
- Flow shows trades, not intent: a large call purchase can be a hedge or one leg of a spread.
- Measuring the expected move against history is not the center of the product.
Verdict: Context on positioning into an event, not a measure of what the market expects.
10. Cboe tools
What it does. Cboe, the exchange operator, offers free tools through the Cboe Options Institute, including an Options Calculator that uses Cboe market data to show how inputs change theoretical option prices and Greeks, and a Trade Optimizer. Cboe also runs LiveVol, a set of web-based options analytics platforms, and DataShop, which sells custom historical data covering options, equities and earnings.
Best for. Learning how implied volatility and time drive option prices, and for professional users who need historical data.
Pricing. The Options Calculator is free. See the vendor's pricing page for LiveVol and DataShop.
Pros
- Exchange-sourced data and strong free education.
Cons
- The free tools are calculators, not event views.
- LiveVol and DataShop are aimed at professional users and priced accordingly.
Verdict: Best for learning how volatility and time drive option prices.
Where this goes wrong
The implied move is the market's price, not a forecast you can count on. Stocks regularly move more or less than the options implied.
Vendors define the expected move differently. One uses the full straddle, another 85% of it, another one standard deviation from implied volatility. Compare numbers from the same tool and the same method.
Expiration choice matters. If the first expiration after the event is weeks away, its implied volatility mixes the event with ordinary days and understates the event alone.
Open interest is a count, not a direction. It does not say who bought, who sold or why, and it is updated once a day.
Wide bid-ask spreads distort everything. On thinly traded options, the straddle midpoint may not be a price anyone could trade at.
Where Dombey falls short
Dombey's Options Research is built for depth on a narrow set of situations. It covers special situations and dated catalysts, so most earnings reports in a given week will not appear in it. If you want to look up any ticker's implied move on demand, a data tool is the right choice.
Dombey is not a broad stock data terminal. There is no option chain, no live quote and no screener of every listed option. The DombeyAI Portal's screener and model are built around the firm's own coverage, not the whole market.
The team is small. Research is published under a pen name, James Whitfield, rather than a named public analyst with a long public record. The published history is short compared with vendors that have run for many years.
Finally, it costs more than most tools here. The Options Research comes only with the Founding Membership at $1,200 per year, while several data tools start free.
Free vs paid
Free options are good enough for many readers. Barchart's expected move pages, OptionCharts' free tier and the delayed tiers at OptionStrat and Unusual Whales show the main numbers. The Cboe Options Calculator is free for learning. If you hold an account at Schwab, tastytrade or Interactive Brokers, the broker platform gives you implied volatility, open interest and scenario tools without a subscription.
Paid plans mostly add live data, full chart access, downloads, alerts and history. Pay for history first: knowing whether a 7% implied move is large or small for a given company depends on what it has done after past reports.
A simple illustration, with numbers that are hypothetical: Company A trades at $50 and reports earnings after the close. The at-the-money straddle in the first expiration after the report costs $4.00. The straddle-to-price ratio is 8%. Using 85% of the straddle, as Barchart describes, gives $3.40, or about 6.8%. If Company A's past post-earnings moves were mostly between 3% and 5%, the current price implies a larger move than usual. If they ranged from 8% to 12%, it implies a smaller one. Neither result says which way the stock will go, and neither is a reason to trade.
How to choose
Start with the question, not the tool.
| Your situation | Pick | Add later when |
|---|---|---|
| You follow special situations and want analysis around the catalyst | Dombey Weekly Options ResearchTop pick | You want to look up any ticker on demand: add Barchart or OptionCharts |
| You want to know if an implied move is large or small for the stock | Market Chameleon | You want to model a position across the date: add OptionStrat |
| You already trade through Schwab, tastytrade or IBKR | Your broker platform | You need earnings history: add Market Chameleon |
| You want a free first look at an event | OptionCharts or Barchart | You want live data and downloads: upgrade to a paid tier |
| You want to watch positioning into an event | Unusual Whales | You want written analysis of the catalyst: add Dombey |
- "How big a move is priced in?" Any tool with an expected move will do: Barchart, OptionCharts, tastytrade or Market Chameleon.
- "Is that large or small for this stock?" You need history. Market Chameleon is built for this.
- "What happens to a position when event volatility comes out?" Use a scenario tool: OptionStrat, thinkorswim or Interactive Brokers' Option Analytics.
- "Where are positions concentrated?" Open interest by strike on OptionCharts or your broker. Flow tools such as Unusual Whales add trade-by-trade detail.
- "Why might this event matter for the business?" That is a research question. Read the filings, our guide on reading a 10-Q for special situations and our overview of event-driven investing. Dombey's published theses are in the research archive.
Then match cost to use. If you look at a few events a quarter, free tools and a broker platform are enough. If you follow many earnings reports each week, a paid history tool pays for its time savings. If you follow special situations such as spin-offs, mergers and court dates, written research on the catalyst can matter more than another data feed.
The bottom line
Dombey's Weekly Options Research is our top pick for readers who follow special situations and want written analysis of a small set of dated catalysts; it works alongside a data tool, not in place of one. For looking up implied moves, implied volatility and open interest on any ticker, Market Chameleon is the closest fit because it puts the current implied move beside past reactions. Broker platforms from Schwab, tastytrade and Interactive Brokers cover the core numbers at no subscription cost for account holders, and OptionCharts and Barchart are strong free starting points. Whatever you use, compare like with like, check the history, and treat the numbers as the market's price rather than a prediction.