

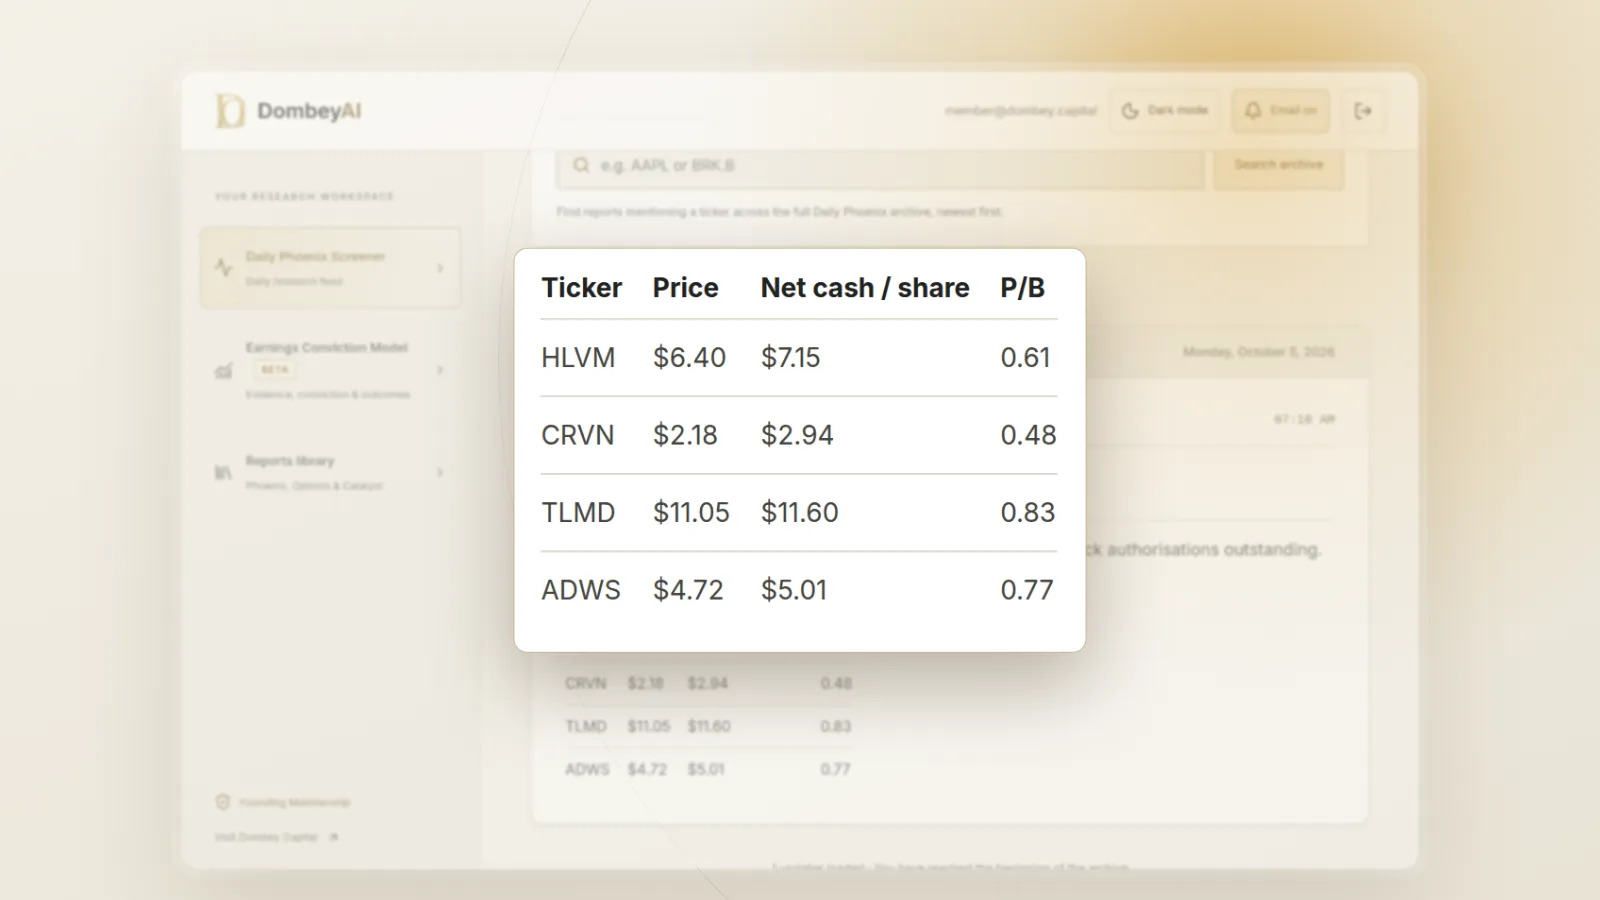


Full disclosure: Dombey Capital is our own research service and our top pick here, for the reasons below. The section on where it falls short is there so you can judge whether it fits your process.
Quick comparison
| Tool | Best for | Key features | Price (as of October 2026) |
|---|---|---|---|
| Dombey Daily Phoenix ScreenerTop pick | Daily special situations shortlist | Each trading morning, inside the DombeyAI Portal | Founding Membership $1,200/year |
| Stock Rover | All-round value screening | 300 to 800+ metrics by tier, equation screening, fair value ratings | Free plan; Premium $29/month, Premium Plus $49/month, Ultimate $79/month billed annually |
| Finviz (Elite) | Fast balance-sheet screens | P/B, P/C, P/FCF, Debt/Equity, EV/EBITDA, EV/Sales filters; export on Elite | Free; Elite $39.50/month or $299.50/year |
| Koyfin | Global screening with custom formulas | 5,900+ filter criteria, 100,000+ global securities, CSV export | Free; Plus $39/month, Premium $79/month billed annually |
| TIKR | Long financial histories, global stocks | 100,000+ global stocks, S&P Capital IQ data, up to 30 years of financials | Free; Plus $24.95/month, Pro $54.95/month, Ultimate $119.95/month |
| GuruFocus | Intrinsic value and guru holdings | All-in-One Screener, GF Value, guru tracking | See the vendor's pricing page |
| TradingView | Charting plus fundamentals | P/B, EV, EV/EBITDA, cash and debt fields | Free; paid plans from $12.95/month billed annually |
| Morningstar Investor | Rating-led long-term screening | 200+ data points, fair value and competitive advantage ratings | $34.95/month or $249/year |
| Simply Wall St | Visual, beginner-friendly screening | Snowflake Screener, DCF fair value, 120,000 stocks | Free; see the vendor's pricing page for paid plans |
| Zacks Premium | Rating-led screens | Zacks Rank, Style Scores including Value, Premium Screens | $249/year |
| Seeking Alpha Premium | Factor-grade screening | Quant Ratings, Value factor grade, custom screeners | $299/year, $4.95 one-month trial |
| Yahoo Finance | Free basic screening | Predefined and custom screeners; fair value on Silver and up | Free; Bronze $95.40/year, Silver $239.40/year, Gold $479.40/year |


How we compared these tools
We compared these tools from vendor documentation, pricing pages and public product pages, read in October 2026. We did not use the tools under paid accounts, so this is a comparison of what each vendor says it offers, not of performance. No claim here concerns any tool's returns or accuracy.
We scored each tool on six criteria that matter to value investors:
- Balance-sheet filters. Can you screen directly on price-to-book, price-to-cash, debt-to-equity and enterprise value, or only on earnings multiples?
- Net cash. Can you screen for companies whose cash exceeds their debt, either with a built-in field or a custom formula?
- Depth of history. How many years of financial statements sit behind each result? Value work often needs a full cycle.
- Coverage. US only, or global? Many deep-value names are small and listed outside the US.
- Export and saving. Can you save screens, set alerts and export results for your own spreadsheet?
- Price. What does the plan that includes the needed features cost, as listed on the vendor's site?
| Criterion | Weight | What it measures |
|---|---|---|
| Balance-sheet filters | 25% | Direct screens on price-to-book, price-to-cash, debt-to-equity and enterprise value |
| Net cash | 20% | A built-in field or custom formula for cash above debt |
| Depth of history | 15% | Years of financial statements behind each result |
| Coverage | 15% | US only or global listings |
| Export and saving | 10% | Saved screens, alerts and export |
| Price | 15% | Listed cost of the plan with the needed features |
Where a vendor's page did not load or did not show a price, we say so rather than estimate.
Quick picks by job
Best for special situations and dated catalysts: Dombey Daily Phoenix Screener
The Daily Phoenix Screener is a daily research resource inside the DombeyAI Portal, published each trading morning for Founding Members. It is not a general filter builder. It suits investors who already screen for value elsewhere and want a daily view of situations tied to Dombey's coverage of special situations.
Best all-round value screener: Stock Rover
Stock Rover lists 800+ financial metrics on its site and supports equation screening, so you can write your own net cash or enterprise value test rather than relying on a preset. Fair value ratings appear on higher plans. Among filter builders, it is the most complete balance of depth and price in this list for a US-focused value investor.
Best for quick price-to-cash and price-to-book screens: Finviz
Finviz's screener includes P/B, P/C (price to cash), P/FCF, Debt/Equity, LT Debt/Equity, EV/EBITDA and EV/Sales filters. A screen for stocks below book with little debt takes seconds. The free version already includes these filters; Elite adds real-time data, export and alerts.
Best for global value screening: Koyfin
Koyfin cites more than 5,900 filter criteria and more than 100,000 global securities. The Premium plan adds unlimited custom data and formulas, which lets you define net cash or an enterprise value ratio your own way.
Best for long financial histories: TIKR
TIKR's Ultimate plan offers up to 30 years of financials, with data from S&P Global Capital IQ. Its screener covers valuation multiples and capital structure, which suits investors who test how a company looked across several cycles.
Best for intrinsic value estimates: GuruFocus
GuruFocus centers its screening on GF Value, its own estimate of a stock's fair trading value, and on tracking what well-known investors hold. Its All-in-One Screener is described on its site as having more than 500 filters.
Best free option: Finviz (free)
The free Finviz screener carries the same core value filters as Elite on delayed data, with up to 50 saved presets.
Full reviews
1. Dombey Daily Phoenix Screener
What it does. The Daily Phoenix Screener is a daily research resource within the DombeyAI Portal, published each trading morning. It gives Founding Members visibility into situations relevant to Dombey's coverage of special situations and event-driven investing. The portal also includes the Earnings Conviction Model.
Best for. Investors who already understand value screening and want a daily shortlist tied to special situations and catalysts, alongside written research.
Pricing. The screener is part of Founding Membership at $1,200 a year, which also includes the weekly Phoenix Report, weekly Options Research, the Biweekly Catalyst Briefing, valuation and execution analysis, and priority access. Standard Access, the lower-cost option at $6.67 a month, includes the Biweekly Catalyst Briefing and the complete public-research archive, but not the screener. The Public Archive is free.
Pros
- It connects screening to dated catalysts and published research, which general screeners do not do.
- A new shortlist each trading morning, with the Earnings Conviction Model in the same portal.
Cons
- It is not a configurable filter builder, and it covers a narrow slice of the market.
- It is the most expensive option here for an investor who only wants a screener.
Verdict: Our top pick for value investors who work in special situations and want a daily, research-backed shortlist. Pair it with a general screener for your own filters.
2. Stock Rover
What it does. Stock Rover is a research and screening platform with portfolio tools, research reports and charting. Its site lists 800+ financial metrics and equation screening.
Best for. US-focused value investors who want to build exact screens, such as net cash above market cap or enterprise value below a multiple of free cash flow.
Pricing. Stock Rover's plans page lists a free plan, Premium at $29 a month, Premium Plus at $49 a month, Ultimate at $79 a month and Ultimate Pro at $149 a month when billed annually, with higher rates on monthly billing. Premium covers 400+ metrics and 5 years of fundamentals; Premium Plus covers 700+ metrics, 10 years of fundamentals, valuation and ratio charts and unlimited fair value ratings; Ultimate covers 800+ metrics and 20 years of fundamentals.
Pros
- Equation screening lets you combine cash, debt and market value into a single test.
- Prebuilt value strategy screens give a starting point.
Cons
- Metric count and history depend heavily on the tier, so the cheapest paid plan may not include the fields you need.
- Check which plan includes equation screening and fair value ratings before subscribing.
Verdict: The strongest all-round filter builder here for US-focused value investors.
3. Finviz (Elite)
What it does. Finviz is a fast web screener with heat maps, charts and news. Its fundamental filter set includes P/E, forward P/E, PEG, P/S, P/B, P/C, P/FCF, EV/EBITDA, EV/Sales, current ratio, quick ratio, debt-to-equity and long-term debt-to-equity, as well as insider and institutional ownership filters.
Best for. Investors who want a quick list of US stocks priced low against book or cash, with low leverage.
Pricing. Free. Finviz Elite is $39.50 a month or $299.50 a year, with a free trial that requires a card.
Pros
- The P/C filter is the closest built-in proxy for a stocks-below-cash screen, and it is in the free version.
- Preset ranges keep screens fast.
- Elite adds real-time data, export to Excel and CSV, unlimited saved presets and alerts.
Cons
- P/C uses gross cash, not net cash, so you must pair it with a debt filter and check the debt yourself.
- No free-form formulas, and coverage centers on US-listed stocks.
Verdict: The fastest route to simple balance-sheet screens on US stocks.
4. Koyfin
What it does. Koyfin is a market data and analysis platform with dashboards, charting, financial statements and a stock and ETF screener. Its screener page cites more than 5,900 filter criteria, more than 100,000 global securities, dozens of templates and CSV download.
Best for. Investors who screen outside the US and want to define their own metrics.
Pricing. Free plan with 2 watchlists and 2 screens. Plus is $39 a month with unlimited watchlists and screens; Premium is $79 a month and adds unlimited custom data and formulas. Those are annual-billing rates; monthly billing costs more. Advisor plans cost more.
Pros
- Global coverage and custom formulas on Premium make a true net cash or enterprise value screen possible.
- Financial statements can be charted across periods.
Cons
- The free plan's two screens are tight for regular use.
- Custom formulas, the most useful feature for net cash work, require Premium.
Verdict: A strong choice for value investors who screen outside the US and define their own metrics.
5. TIKR
What it does. TIKR is a global stock research terminal that cites coverage of more than 100,000 stocks across 92 countries and 136 exchanges, using S&P Global Capital IQ data. Its screener offers filters on financials, ratios, valuation multiples, capital structure, growth rates and margins. It also tracks holdings of more than 10,000 investors and includes a valuation model builder.
Best for. Investors who want long histories and international small caps.
Pricing. Free (US only, 5 years of financials, 1 saved screen). Plus is $24.95 a month, Pro $54.95 a month and Ultimate $119.95 a month, each with a 14-day money-back guarantee. History runs from 10 years on Plus to 30 years on Ultimate; saved screens run from 10 on Plus to unlimited on Ultimate.
Pros
- Capital structure filters and deep history suit balance-sheet work.
- Global coverage starts at the Plus tier.
Cons
- The free tier is US only and allows one saved screen.
- Long histories require the higher tiers.
Verdict: The pick for investors who want to see a company across several cycles.
6. GuruFocus
What it does. GuruFocus is a value-oriented research site built around GF Value, its proprietary estimate of a stock's fair trading value, and around tracking the holdings of well-known investors. GuruFocus describes its All-in-One Screener as having more than 500 filters across fundamentals, valuation ratios, valuation ranks, profitability, growth, dividends, gurus and insiders, with backtesting on higher tiers.
Best for. Investors who want an intrinsic value estimate beside each result and like to see which well-known investors own a stock.
Pricing. See the vendor's pricing page. GuruFocus's pricing page did not load for us in October 2026.
Pros
- A value focus throughout, including valuation ranks and guru filters.
- Backtesting on higher plans.
Cons
- GF Value is a model output, not a fact, and it depends on its inputs.
- Pricing varies by plan and region, so check it directly.
Verdict: Useful if you want an intrinsic value estimate and guru holdings beside each result.
7. TradingView
What it does. TradingView is primarily a charting platform, with a stock screener that its support pages say covers P/B, P/E, PEG, EV/EBITDA, market cap, enterprise value, balance-sheet items such as cash and debt ratios, cash flow figures and per-share fundamentals.
Best for. Investors who chart heavily and want fundamentals in the same place.
Pricing. Free plan with no card required. Paid plans billed annually are Essential at $12.95 a month, Plus at $29.95, Premium at $59.95 and Ultimate at $199.95. Monthly billing costs more.
Pros
- Enterprise value, cash and debt fields sit in the same screener as technical filters.
- The free plan is usable.
Cons
- Built for traders first, so value-specific presets and long statement histories are not its focus.
Verdict: Fits value investors who already chart in TradingView.
8. Morningstar Investor
What it does. Morningstar Investor combines Morningstar's ratings, analyst research, portfolio tools and screeners. Its product page describes screens built from more than 200 data points and ratings covering fair value and competitive advantage for stocks.
Best for. Long-term investors who want an analyst's fair value estimate and competitive advantage rating as the starting point.
Pricing. $34.95 a month or $249 a year, with a seven-day free trial.
Pros
- Analyst fair value estimates give a second opinion beside your own numbers.
- Saved views work across portfolios, watchlists and screeners.
Cons
- Screening is rating-led, with fewer direct balance-sheet filters than Finviz or Stock Rover.
Verdict: Best for long-term investors who want a rating as the starting point.
9. Simply Wall St
What it does. Simply Wall St presents company analysis visually through its Snowflake graphic and a discounted cash flow fair value estimate. Its site cites coverage of 120,000 stocks across 90 markets, and its Snowflake Screener filters the global market for growth, value or dividend criteria, with alerts.
Best for. Newer investors who want a visual summary before reading the financials.
Pricing. Free plan with limits, including top-four screener results, one saved screener and five company reports a month. Paid Premium and Unlimited plans are available after a 7-day trial; see the vendor's pricing page, since prices were not shown on the plans page we read.
Pros
- Clear visuals and global coverage.
- The DCF fair value is shown on every company.
Cons
- Screens are built around Snowflake scores, so exact tests such as net cash above market cap are harder to express.
- The free plan's top-four result limit makes it a preview rather than a working screener.
Verdict: A friendly starting point for newer investors, less suited to exact balance-sheet tests.
10. Zacks Premium
What it does. Zacks Premium adds the Zacks Rank, Style Scores, Premium Screens, equity research reports and the Focus List portfolio to Zacks's free site. Premium Screens are grouped into Value, Growth, Momentum, VGM, Income and other categories, with value screens built around Zacks Value Style Scores and valuation ratios.
Best for. Investors who want rating-led value screens without building their own.
Pricing. $249 a year on Zacks's order page, with a free trial offered.
Pros
- Ready-made value screens and a Value Style Score make a fast starting point.
Cons
- Screens lean on Zacks's own ranking system; raw net cash or enterprise value screens need a more flexible tool.
- Zacks also markets separate, more expensive services, so check which product includes the screener you want.
Verdict: Suits investors who want rating-led value screens without building their own.
11. Seeking Alpha Premium
What it does. Seeking Alpha Premium adds Quant Ratings, factor grades and screeners to Seeking Alpha's articles and data. Its help pages say Quant Ratings compare more than 100 metrics for each stock against its sector, and that each stock receives grades from A+ to F for Value, Growth, Profitability, Momentum and EPS Revisions. Users can build custom screeners or use preset ones.
Best for. Investors who want a Value grade relative to sector peers alongside author research.
Pricing. $299 a year. New subscribers can start with a one-month paid trial for $4.95.
Pros
- Sector-relative Value grades help when comparing industries with very different normal multiples.
Cons
- Grades summarize many metrics into one letter, hiding balance-sheet detail.
- Raw net cash screening is not described on the pages we read.
Verdict: Useful for a sector-relative value grade beside author research, not for deep-value balance-sheet screens.
12. Yahoo Finance
What it does. Yahoo Finance offers free predefined and custom stock screeners, including value and growth presets and screens based on well-known investors' holdings. Paid tiers add research, fair value analysis and downloadable history.
Best for. Beginners who want a free starting point and already use Yahoo Finance for quotes.
Pricing. Free. When billed yearly, Bronze is $95.40, Silver $239.40 and Gold $479.40. Silver adds Morningstar ratings, research reports and fair value analysis. Gold adds downloadable history of about 40 years of financial statements and a Smart Money Screener, with a 7-day free trial.
Pros
- Free, familiar and widely used.
- Gold's long statement history is useful for checking a screen's results.
Cons
- Several screeners require a paid tier.
- The free screener's balance-sheet filters are less direct than Finviz's.
Verdict: A free starting point for beginners who already use Yahoo Finance.
Where Dombey falls short
Dombey is a research service with a screener inside it, not a screening platform, and it should be judged that way.
- Narrow coverage. The Daily Phoenix Screener covers situations relevant to Dombey's special situations work. It does not scan the whole market on your own criteria.
- No broad stock data terminal. There are no free-form filters, statement histories or export tools of the kind Stock Rover, Koyfin or TIKR provide. Most members will still need one of those tools.
- Small team. Coverage depth depends on a small research team, not a large analyst staff.
- Pen-name author. Published research appears under a pen name, which some readers will weigh against it.
- Short history. The research record is young. Dombey publishes each thesis before its catalyst and keeps it in the research archive, but there are fewer years of history to review than at long-established providers.
- Price for screening alone. At $1,200 a year, Founding Membership costs far more than any screener here. It only makes sense if you want the research, not just a list.
Free vs paid
Free tiers are enough to learn value screening. Finviz's free screener already includes P/B, P/C and debt-to-equity filters on delayed data. TradingView's free plan includes its fundamental screener. Yahoo Finance offers free predefined screens. Koyfin, TIKR, Stock Rover and Simply Wall St all have free plans, but each limits saved screens, history, coverage or results.
Paying makes sense when you need one of four things:
- Custom formulas, to screen on true net cash or your own enterprise value ratio (Stock Rover equation screening, Koyfin Premium).
- Long history, to see a company across a full cycle (TIKR Ultimate, Stock Rover's higher tiers, Yahoo Finance Gold).
- Global coverage, for small caps listed outside the US (Koyfin, TIKR paid tiers, Simply Wall St).
- Export and alerts, to move results into your own model (Finviz Elite, Koyfin).
A useful check: run the same screen on a free tier for a month. If you keep exporting results to a spreadsheet to finish the job, the paid feature you are missing is usually custom formulas.
How to choose
Start from the screen you actually run. A typical deep-value screen looks like this, with illustrative thresholds:
| Filter | Example threshold | Why it matters |
|---|---|---|
| Price-to-book | Below 1.0 | Market value below accounting equity |
| Price-to-cash | Below 1.5 | Share price close to cash per share |
| Debt-to-equity | Below 0.3 | Little debt to claim the cash first |
| Net cash vs market cap | Net cash above 50% of market cap | Much of the price backed by cash |
| Enterprise value | Low or negative | Operating business valued near zero |
Then match the tool to your situation:
| Your situation | Pick | Add later when |
|---|---|---|
| You want a daily special situations shortlist with research | Dombey Daily Phoenix ScreenerTop pick | You want your own filters: add Finviz or Stock Rover |
| You run simple price-to-book and price-to-cash screens | Finviz (free) | You need export and alerts: move to Finviz Elite |
| You need exact net cash and enterprise value tests | Stock Rover | Your candidates are listed abroad: add Koyfin or TIKR |
| Your candidates are often outside the US | Koyfin | You want 20 to 30 years of history: add TIKR |
| You want a fair value estimate beside each result | Morningstar Investor | You want catalyst-driven ideas: add Dombey |
In more detail:
- If you only need the first three rows, Finviz free or Elite is enough.
- If you need the net cash and enterprise value rows exactly, pick a tool with custom formulas: Stock Rover or Koyfin Premium.
- If your candidates are often listed outside the US, choose Koyfin or TIKR.
- If you want a rating or fair value estimate beside each result, choose Morningstar Investor, GuruFocus or Seeking Alpha.
- If you want a daily list tied to dated catalysts and written research, the Daily Phoenix Screener fits, alongside a general screener.
Whichever you choose, treat the output as a shortlist. Screener data comes from standardized feeds that can miss restricted cash, lease liabilities, preferred stock or convertible debt. The steps in how to find stocks trading below net cash and how to read a 10-Q for special situations show how to confirm each figure.
Where this goes wrong
Value screens produce many false positives. A company below cash may be burning that cash. A company below book may be carrying assets that will be written down. Screener fields can lag the latest filing by a quarter, and cash held abroad or in restricted accounts may not be available to shareholders. A screen is the start of the work, not the result.
The bottom line
Dombey's Daily Phoenix Screener is our top pick for value investors who want a daily special situations shortlist tied to dated catalysts and written research. It complements a general screener rather than replacing one. Among filter builders, Stock Rover is the best all-round choice, and Finviz is the fastest route to simple price-to-cash, price-to-book and debt-to-equity screens. Koyfin and TIKR are the stronger choices for global and long-history work. Rating-led tools such as Morningstar Investor, Zacks and Seeking Alpha suit investors who want a second opinion more than raw filters.