

The formula
The SEC's beginners' guide to financial statements states the balance sheet identity: assets equal liabilities plus shareholders' equity. Debt-to-equity compares one slice of the right-hand side with the other.
Debt-to-equity = total debt / total shareholders' equity
Both numbers come from the same balance sheet in the latest 10-Q or 10-K, so they share a date. Regulation S-X, the SEC rule on the form of financial statements, sets out the balance sheet captions you will see. Notes payable to banks and commercial paper appear in current liabilities, and long-term debt sits under the caption for bonds, mortgages and other long-term debt, including capitalized leases, with each issue's interest rate and maturity described. Common stock, retained earnings and other equity items make up stockholders' equity.
Total debt usually means:
- Short-term borrowings and commercial paper
- The current portion of long-term debt
- Long-term debt, net of the current portion
- Finance or capital lease obligations
Total shareholders' equity is the bottom line of the equity section. If the company has noncontrolling interests, decide whether to include them and stay consistent.
Which debt to count
Data providers do not agree on the numerator, which is why the same company can show different ratios on different sites. These are the main choices.
| Version | Numerator | When it helps | Watch for |
|---|---|---|---|
| Total liabilities to equity | All liabilities | Quick view of everything owed | Counts payables and deferred revenue as if they were loans |
| Total debt to equity | Interest-bearing borrowings | The standard measure of financial leverage | Leaves out leases and preferred stock unless added |
| Long-term debt to equity | Debt due after one year | Focus on permanent capital structure | Ignores debt due in the next 12 months, often the riskiest |
| Net debt to equity | Total debt less cash and short-term investments | Companies holding large cash balances | Cash may be trapped abroad or needed to run the business |
| Debt plus leases to equity | Total debt plus lease liabilities | Retailers, airlines and others with large lease books | Lease terms vary, so comparability is imperfect |
Two items need a decision every time.
Leases. Many balance sheets now carry lease liabilities for stores, offices, aircraft and equipment. A company that leases its locations and one that borrows to buy them have similar fixed obligations. If you compare the two, add leases to both or to neither.
Redeemable preferred stock. Regulation S-X requires preferred stock that must be redeemed, or whose redemption is outside the issuer's control, to be shown in its own caption and not combined with stockholders' equity. It behaves more like debt than equity. Preferred stock redeemable only at the company's option is reported with equity. Count mandatory or holder-redeemable preferred in the numerator.
What counts as high
The honest answer is that "high" depends on how stable the cash flow is and how easily the assets could be sold or borrowed against. A business with contracted revenue and long-lived assets can carry far more debt than one whose sales swing with the economy.
| Business type | Typical funding pattern | How to read the ratio |
|---|---|---|
| Software and services | Little debt, few hard assets | Even a moderate ratio stands out; check why the company borrowed |
| Industrial and consumer companies | Mix of debt and equity | The rough guide above applies best here |
| Utilities and infrastructure | Heavy long-dated debt against regulated cash flow | High ratios are normal; focus on interest coverage and rate decisions |
| Real estate owners | Property-secured mortgages | Book equity understates property values, so the ratio overstates leverage |
| Banks and insurers | Balance sheet funded by deposits or policy reserves | The ratio says little; use capital ratios and tangible book |
| Companies after a buyout or recapitalization | Debt raised to fund a payout | Ratio may be very high or equity negative; read the debt terms |
Three comparisons put a single number in context:
- Against the company's own history. A ratio that rose from 0.6 to 1.8 in two years tells you more than the level of 1.8 alone. Find out what changed: an acquisition, a buyback funded with debt, or losses eating into equity.
- Against similar businesses. Compare with companies that have the same kind of assets and revenue, not the same sector label.
- Against cash flow. Debt divided by EBITDA or by free cash flow shows how many years of earnings it would take to repay. See EV/EBITDA explained for the limits of EBITDA as a cash measure.
A worked example
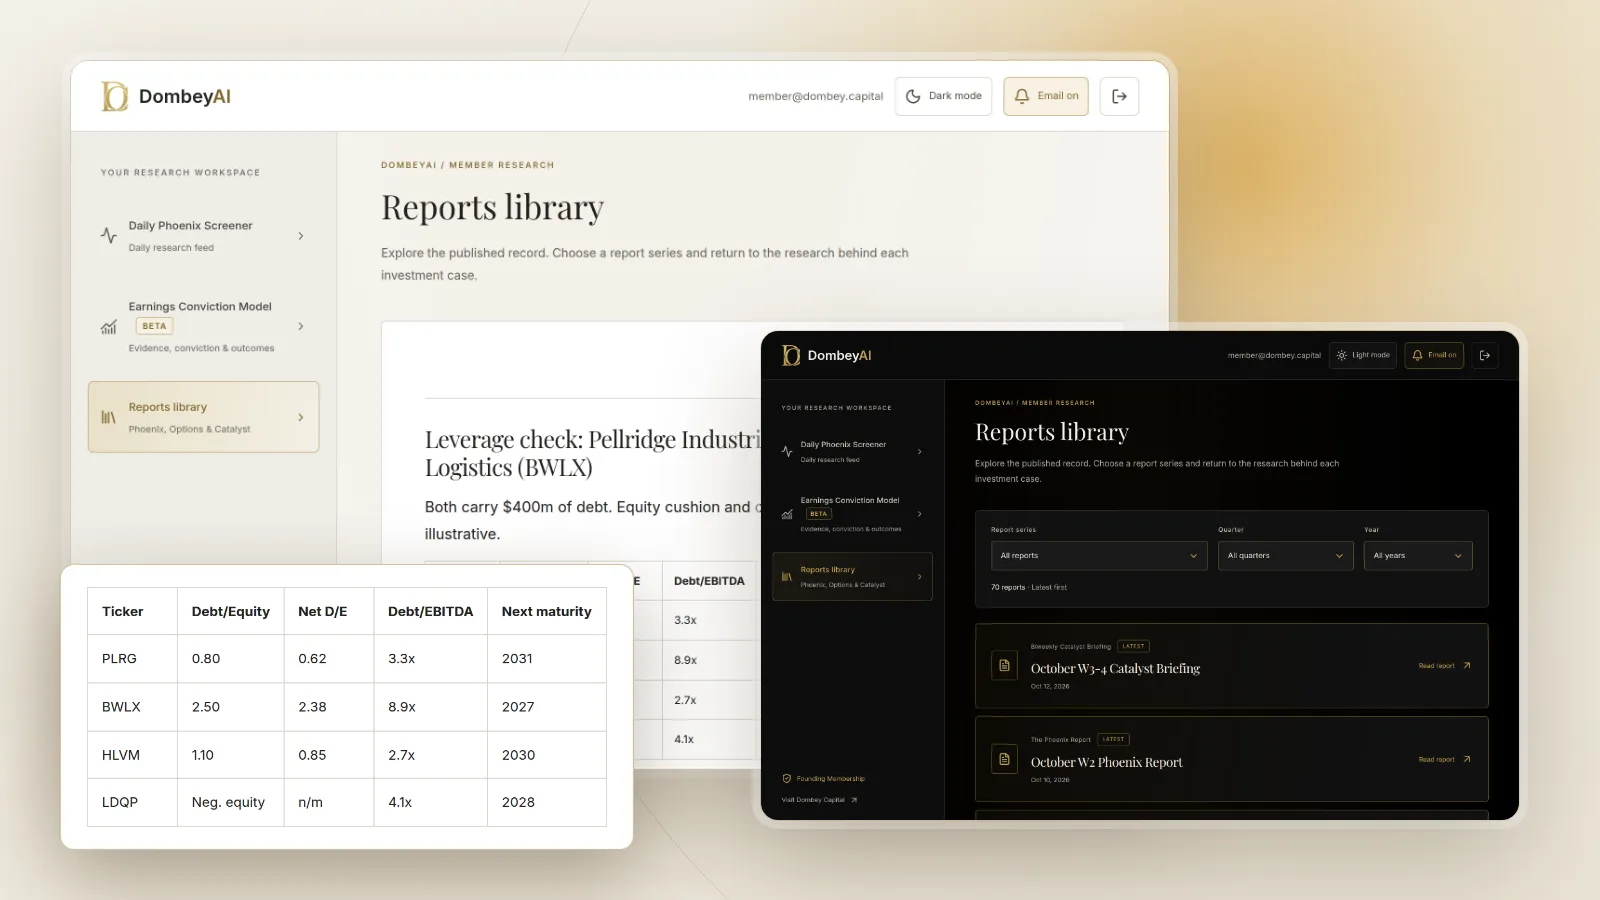
Same debt, very different risk. Company A's lenders are covered by a large equity cushion and by earnings. Company B has a thin cushion and would need almost nine years of EBITDA, before interest, tax and capital spending, to repay what it owes. The debt-to-equity ratio flags the difference, and the debt-to-EBITDA figure confirms it.
Now change one fact. Suppose Company B owns warehouses carried at cost decades ago that would sell for far more today. Its book equity understates the real cushion, and the ratio overstates the risk. Our piece on real estate hidden in balance sheets covers how to value that kind of asset.
When book equity is small or negative
The denominator causes more trouble than the numerator. Book equity is an accounting figure, and several things shrink it without any change in debt:
- Buybacks and dividends. A profitable company that returns more cash than it earns reduces equity each year. Some mature companies end up with negative equity while their debt stays steady and well covered.
- Write-downs. Impairing goodwill or other assets cuts equity in one quarter. Debt-to-equity jumps even though nothing changed for the lenders.
- Accumulated losses. A company that loses money year after year eats through its equity. Here the rising ratio is a genuine warning, often alongside a going-concern warning.
The opposite problem also exists. Goodwill from past acquisitions can inflate book equity and make leverage look lower than it is. Recomputing the ratio on tangible book value strips that out.
Book value or market value
Debt-to-equity uses book equity by default. A second view divides debt by the market value of equity, the share price times shares outstanding. That version shows how much of the company's enterprise value belongs to lenders.
The two can point in opposite directions. A company trading well above book has low market leverage even if book leverage looks high. A company trading far below book, the kind that shows up on price-to-book screens, has high market leverage even when book leverage looks moderate. For stocks trading below book, the market version is often the more honest one, since it reflects what investors think the equity is worth.
How to use the ratio in a screen
Debt-to-equity is a filter, not a verdict. A practical sequence:
- If the ratio is low and net debt is negative, the balance sheet is not the issue. Check whether the cash is usable, as in net cash per share.
- If the ratio is moderate, move on to earnings quality and valuation, but note when the debt matures.
- If the ratio is high, check debt against EBITDA and free cash flow, the interest rate on the debt, the maturity schedule and any maintenance covenants in the credit agreement.
- If equity is negative, ignore the ratio and work from cash flow coverage and market value.
- If the ratio rose sharply, find the cause in the latest filing before drawing a conclusion.
Each quarter's 10-Q updates both numbers. Our guide to reading a 10-Q for special situations shows where debt and equity changes are explained, and EDGAR full-text search finds the credit agreements filed as exhibits.
Dombey's published research checks leverage against cash flow and the debt schedule before each catalyst; see the research archive.
Where this goes wrong
- Mixing definitions. Comparing one company's total-liabilities ratio with another's total-debt ratio produces nonsense. Build both yourself from the filings.
- Ignoring off-balance-sheet obligations. Guarantees, purchase commitments and pension deficits can be large. Read the commitments and contingencies note.
- Trusting book equity. Old asset values, goodwill and buybacks all distort it, in both directions.
- Reading the level without the timing. A ratio of 1.5 with debt due in ten years is a different risk from 1.5 with debt due in nine months.
- Using a stale balance sheet. Debt can change a lot within a quarter after a deal or a refinancing. Check recent 8-K filings for new borrowings.
- Treating low debt as safety. A company with no debt can still destroy value by burning cash. Low leverage is one reason a cheap stock can still be a value trap, not a defense against one.
The bottom line
The debt-to-equity ratio shows how much of a company is funded by lenders against each dollar of book equity. What counts as high depends on the business: stable, asset-heavy companies carry more debt than cyclical or asset-light ones, so compare with the company's history and with similar businesses. Pick a clear definition of debt, include leases and redeemable preferred stock where they matter, and watch for small or negative equity that makes the ratio meaningless. Then confirm the picture with debt against cash flow, market value and the maturity schedule.