

How a maturity wall forms
Companies tend to borrow in waves. A leveraged buyout, a large acquisition or a period of cheap credit leads a company to issue several loans and bonds at once, often with similar terms. Five or seven years later they come due close together.
The pattern repeats across sectors. When many issuers borrowed in the same low-rate years, a large share of a whole market can mature in the same window, and analysts talk about a market-wide wall. For a single stock, though, only the company's own schedule matters.
Three features make a wall dangerous rather than routine:
- Size. The amount due is large compared with cash, free cash flow and undrawn credit lines.
- Cost. The old debt carries a coupon well below what the company would pay today.
- Weak credit. Earnings are flat or falling, leverage is high, or the business faces a structural problem that lenders can see.
Where to find the maturity schedule
Two parts of the annual report do most of the work. Both are covered in our guide to the 10-K.
The debt note. The notes to the financial statements list each borrowing: the amount, the interest rate, the maturity date and whether it is secured. Most companies also give a table of principal due in each of the next five years and the total after that. This is the wall in its simplest form.
The liquidity discussion. Regulation S-K Item 303(b)(1) requires management to analyze the company's ability to generate and obtain enough cash to meet its requirements in the short term, meaning the next 12 months from the most recent fiscal period end, and separately in the long term, beyond the next 12 months. The discussion must analyze material cash requirements from known contractual and other obligations and specify the type of obligation and the time period. This is where management says how it plans to meet a maturity.
Each 10-Q updates the picture. Debt due within a year moves into current liabilities on the balance sheet, and the liquidity section often changes tone as a maturity gets close. Our guide to reading a 10-Q for special situations shows where to look.
Two 8-K items track the wall in real time. Item 2.03 requires a filing when a company becomes obligated on a material direct financial obligation, such as a new term loan or bond, with the amount, payment terms and the terms under which it may be accelerated. Item 2.04 requires a filing when a triggering event, such as an event of default or acceleration, increases or accelerates such an obligation. Unless the form says otherwise, an 8-K is due within four business days of the event. You can set alerts for these through EDGAR search.
Sizing the refinancing gap
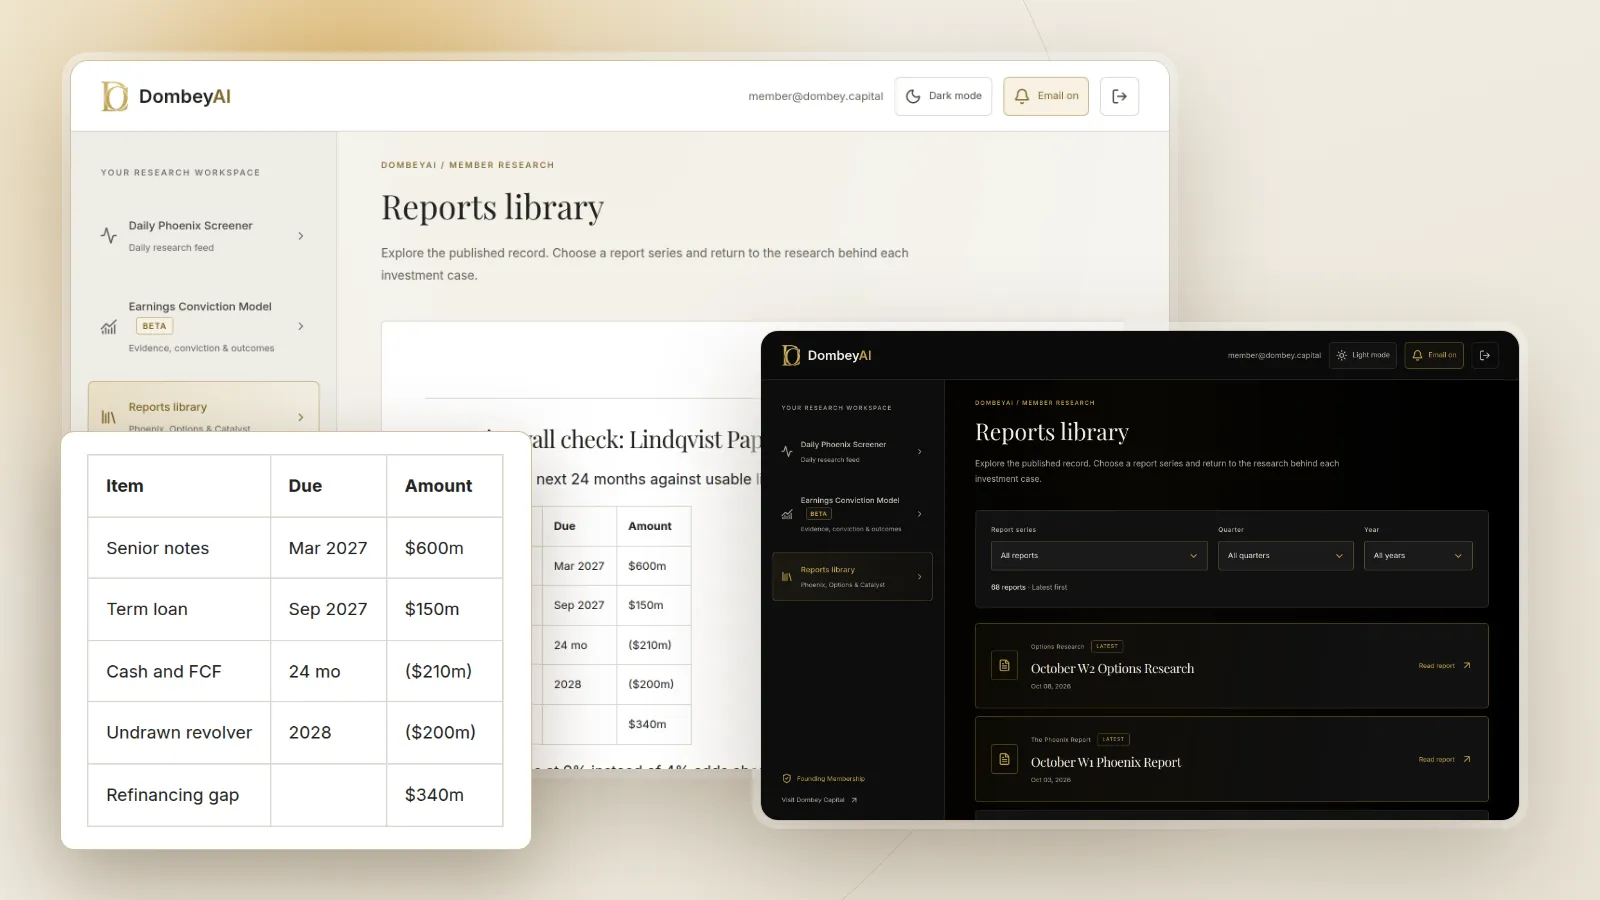
The core calculation compares what is due with what the company can pay without going back to the market.
| Line | What it means | Where to find it |
|---|---|---|
| Debt due in window | Principal maturing in the next 12 to 24 months | Debt note, current liabilities |
| Unrestricted cash | Cash the company can actually use | Balance sheet, liquidity section |
| Free cash flow in window | Operating cash flow less capital spending, after interest | Cash flow statement, your forecast |
| Undrawn committed credit | Revolver capacity the lenders must fund | Debt note, credit agreement |
| Refinancing gap | Debt due less the three sources above | Your calculation |
A gap of zero or less means the company can meet the wall from its own resources. A positive gap is the amount it must raise from new debt, equity or asset sales. Note whether the revolver itself matures in the window; a credit line that expires alongside the bonds is not a source.
The cost of rolling the debt
Even a company that can refinance may pay much more to do it. Continue with Company A. Its $600m of notes carry a 4% coupon, or $24m a year in interest. If comparable new debt costs 9%, rolling the full $600m adds $30m a year in interest.
| Item | Old notes | New notes | Change |
|---|---|---|---|
| Principal | $600m | $600m | none |
| Coupon | 4% | 9% | +5 points |
| Annual interest | $24m | $54m | +$30m |
| EBITDA | $260m | $260m | none |
| Note interest as a share of EBITDA | 9.2% | 20.8% | +11.6 points |
The extra $30m comes straight out of free cash flow and pre-tax earnings. For a company valued on earnings, that alone can move the share price. It also matters through enterprise value: when debt is a large part of the capital structure, a small change in the business value or the cost of debt makes a large change in what is left for the equity.
How a wall gets resolved, and what each outcome means for the equity
A maturity is a known date, which makes it a hard catalyst in the sense that something must happen by then. The outcomes run roughly from best to worst for shareholders:
- If the company repays from cash and cash flow, leverage falls and the risk is gone. The stock often re-rates once the market stops pricing in a bad outcome.
- If it refinances in the bond or loan market, watch the new coupon, the new maturity and any added security or covenants. A clean deal well ahead of the date removes the overhang.
- If it extends with existing lenders (an amend and extend), the date moves out, usually at a higher spread and with fees. The risk is postponed, not removed.
- If it sells assets, the price and the earnings given up matter. A forced sale near the deadline tends to fetch less.
- If it raises equity, existing holders are diluted. A rights offering lets them take part; a discounted placement does not.
- If it does a distressed exchange, bondholders swap into new debt with a lower principal or later date, sometimes with equity attached. Shareholders are often diluted heavily.
- If none of that works, the company may file for Chapter 11, where existing shares are usually cancelled. Our piece on post-bankruptcy equities covers what happens to the new shares.
Timing tells you a lot. A company that refinances 18 months early is showing that it has market access. One that is still talking to advisers six months before the date is showing that it may not.
Clauses that move the wall forward
The stated maturity is not always the real one. Read the credit agreement and indentures, which are usually filed as exhibits, for these terms:
- Springing maturities. A term loan may become due early if a bond ahead of it is still outstanding a set number of days before the bond matures. The earliest date in the structure then becomes the wall for everything behind it.
- Cross-default and cross-acceleration. A default on one instrument can let the holders of another demand repayment. One missed payment can bring the whole stack due.
- Maintenance covenants. A loan may require leverage or interest coverage to stay inside a limit every quarter. A breach can give lenders the right to accelerate long before maturity.
- Going-concern language. Under US accounting standards, management must evaluate whether there is substantial doubt about the company's ability to continue for one year after the financial statements are issued. A maturity inside that year with no plan to meet it often triggers the disclosure, and auditors may add a going-concern paragraph to the report.
A timeline to track
Dates on a maturity calendar can be placed on the same catalyst calendar as earnings and votes.
| Time before maturity | Event | What to check |
|---|---|---|
| 24 to 18 months | Debt moves toward current liabilities | Liquidity section wording, refinancing plans |
| 18 to 12 months | Window for a clean refinancing | 8-K Item 2.03 filings for new debt, coupon paid |
| 12 months | Going-concern evaluation in scope | Auditor's report, risk factors, advisers hired |
| 12 to 6 months | Amend and extend or exchange talks | Lender consents, exchange offer filings |
| Under 6 months | Last resort options | Asset sales, equity raises, 8-K Item 2.04 events |
Where this goes wrong
- Counting cash that is not free. Cash held abroad, in restricted accounts or needed to run the business does not pay down debt. Our note on net cash per share covers the same adjustment.
- Assuming the revolver is there. Credit lines can shrink, carry conditions or mature in the same window. Some cannot be drawn if a covenant is breached.
- Forecasting free cash flow that does not arrive. The weakest companies face the largest walls, and their cash flow is often the first thing to disappoint.
- Ignoring the coupon reset. Even a successful refinancing can cut earnings enough to lower the stock.
- Missing the structure. Debt at a subsidiary, secured debt ahead of unsecured debt and guarantees change who gets paid first and what the equity is left with.
- Treating the date as fixed. Springing maturities, covenants and cross-defaults can bring the wall forward. Extensions can push it back.
Dombey's published research checks the maturity schedule and the refinancing gap before each catalyst; see the research archive.
The bottom line
A debt maturity wall is a cluster of debt coming due close together, and refinancing risk is the chance the company cannot replace it on acceptable terms. Map the wall from the 10-K debt note and the Item 303 liquidity discussion, then size the gap against usable cash, free cash flow and committed credit. Price the cost of rolling the rest at current rates, and read the credit agreement for clauses that move the date earlier. The equity outcome depends less on the size of the wall than on whether the company can cover it before it arrives.