

What the two halves measure
Enterprise value is the value of all the claims on the operating business: equity at market value, plus debt, preferred stock and noncontrolling interest, minus cash. It does not change if a company swaps debt for equity.
EBITDA starts from net income and adds back four items:
- Interest, because it is paid to lenders, who are already counted in enterprise value.
- Taxes, because tax positions differ by country, by loss carryforwards and by structure.
- Depreciation, a non-cash charge that spreads the cost of past equipment purchases.
- Amortization, a non-cash charge on intangible assets, often from past acquisitions.
The pairing is consistent. Both halves sit before interest, so both belong to lenders and shareholders together. That is the main reason EV/EBITDA exists: it removes the effect of financing choices from the comparison.
SEC staff guidance on non-GAAP measures defines the term narrowly. "Earnings" in EBITDA means net income as presented in the GAAP income statement, and a company that presents EBITDA as a performance measure in a filing should reconcile it to net income, not to operating income. The same guidance says EBITDA must not be shown on a per-share basis.
How to read the multiple
Think of EV/EBITDA as a rough payback period. At 6 times, a buyer of the whole business would recover the price in six years of current EBITDA, before paying for equipment, interest or tax. At 15 times, the market expects that EBITDA to grow, to be unusually durable, or both.
The number only means something against a reference point:
- The company's own history. A multiple well below its usual range asks what changed: the outlook, the balance sheet, or only the share price.
- Close peers. Pick businesses with similar capital needs, growth and cyclicality. Sector averages hide wide spreads.
- Deal and lending terms. Lenders size loans as a multiple of EBITDA, and acquirers often describe prices the same way. That makes the ratio a useful check on what a buyer could finance.
Where EV/EBITDA is useful
| Use | Why it works | What to pair it with |
|---|---|---|
| Comparing companies with different debt | Enterprise value and EBITDA both sit before interest | Net debt to EBITDA |
| Comparing across tax positions | Taxes are excluded from both halves | Cash taxes paid from the cash flow statement |
| Takeover and buyout screens | Buyers pay enterprise value and borrow against EBITDA | Free cash flow after capital spending |
| Valuing segments in a sum of the parts | Segment notes often give a profit measure close to EBITDA | Peer multiples for each segment |
| Post-restructuring and spin-off companies | Reported earnings are distorted by one-off charges and new capital structures | Standalone costs and the new debt load |
It is least useful for banks and insurers, where interest is the business and debt is raw material, and for companies with negative or tiny EBITDA, where the ratio swings wildly or has no meaning. For an early-stage company with no profit, price to sales or cash runway does more work.
A worked example: same multiple, different businesses
| Line | Company A | Company B |
|---|---|---|
| Enterprise value | $800m | $800m |
| EBITDA | $100m | $100m |
| EV/EBITDA | 8.0x | 8.0x |
| Capital expenditures | ($15m) | ($60m) |
| Cash taxes | ($18m) | ($8m) |
| Unlevered free cash flow (before working capital) | $67m | $32m |
| EV/unlevered free cash flow | 11.9x | 25.0x |
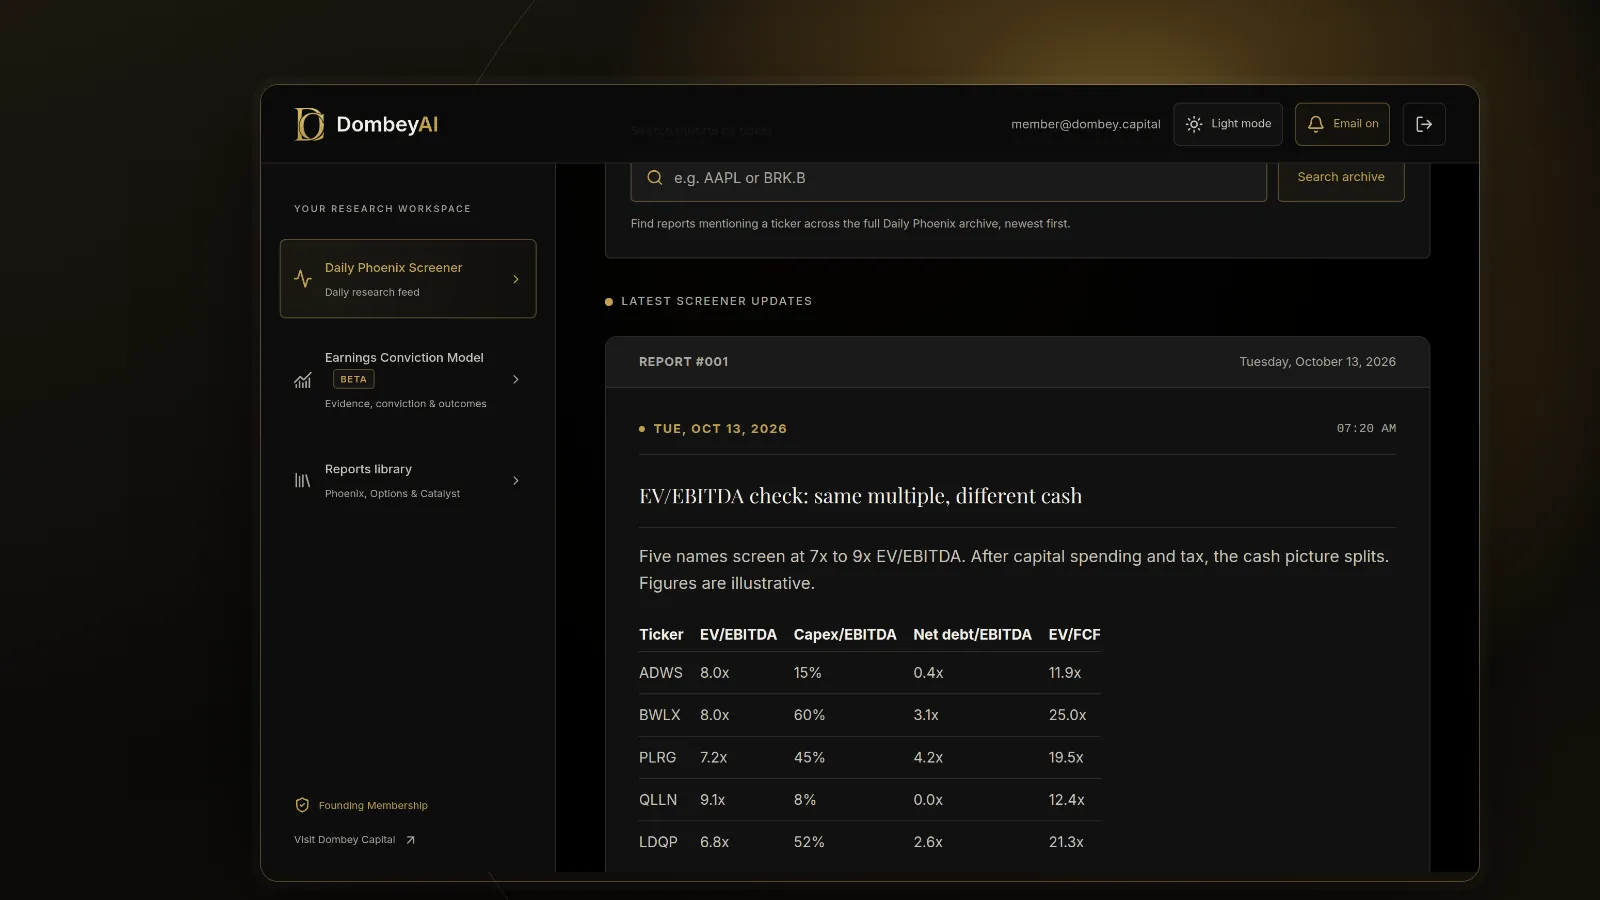
On EBITDA the two look identical. Company A is a light-asset services business; Company B runs a fleet of trucks it must keep replacing. After capital spending and tax, Company A produces about twice the cash for the same price. The same comparison on EV/EBIT, which subtracts depreciation, would usually point the same way, since depreciation tends to track the equipment a business has to buy. Our piece on free cash flow yield covers that cash-based view in full.
The blind spots
Capital spending
This is the largest one. EBITDA adds back depreciation as if the equipment that produced the profit were free. For a software company that may be close to true. For a shipping line, a paper mill or a telecom network, depreciation is a rough estimate of the cost of staying in business. Ignoring it flatters capital-heavy companies.
Working capital
EBITDA is an accrual measure. A company that books revenue it has not collected, or builds inventory, shows EBITDA that has not become cash. Compare EBITDA with cash from operations over several years. A persistent gap is a warning.
Adjusted EBITDA
Many companies report adjusted EBITDA, which removes further items they choose: restructuring, litigation, acquisition costs, stock-based compensation, and sometimes costs labeled one-off that recur every year. SEC staff guidance says a measure calculated differently from EBITDA should not be called EBITDA and should carry a different title, such as adjusted EBITDA. Rebuild the figure from the income statement and cash flow statement before using any multiple built on it. The 10-K is where the reconciliation and the underlying notes sit.
Stock-based compensation
It is non-cash, so it is added back in many adjusted figures. It still costs shareholders through dilution. If adjusted EBITDA excludes it, either subtract it yourself or track the growth in the diluted share count.
Leases and the denominator match
Operating lease costs sit inside ordinary EBITDA as rent. If you add lease liabilities to enterprise value, you must use a figure before rent, often called EBITDAR. Mixing the two overstates the multiple for companies with large lease books.
Interest and the debt itself
EBITDA ignores interest by design. A company on 7 times with net debt of 5 times EBITDA has far less room than one on 7 times with no debt, because lenders are paid first. Read the multiple next to net debt to EBITDA and the maturity schedule; our piece on the debt maturity wall shows how refinancing at higher rates can absorb a large share of EBITDA.
Cyclical peaks
Trailing EBITDA at the top of a cycle makes a multiple look low just before profits fall. For commodity and cyclical businesses, use an average across a full cycle or a normalized figure. Many value traps look cheap on peak earnings.
Consolidation
If enterprise value includes noncontrolling interest, EBITDA should be the consolidated figure including 100% of the partly owned subsidiary. If you subtract an equity-method stake from enterprise value, take its income out of EBITDA. A mismatch here is invisible in the ratio.
Where this goes wrong
- Ranking a screen on EV/EBITDA alone. The cheapest names on a screen are often the most capital-intensive, the most indebted or the closest to a cyclical peak.
- Using the company's adjusted figure as given. Adjustments rarely add costs back in. Each one you accept lowers the multiple.
- Comparing across industries. A multiple that is low for software can be high for a utility. Compare within groups that spend similar amounts on capital.
- Using a stale balance sheet. The share price is today's; the debt and cash may be from a quarter ago. A new loan or a quarter of cash burn changes enterprise value.
- Ignoring what EBITDA will become. For a spin-off or carve-out, historical EBITDA often omits standalone costs. For a company emerging from bankruptcy, it may reflect a business that is still shrinking.
- Treating a negative multiple as extremely cheap. Negative EBITDA means the ratio does not apply. Negative enterprise value is a separate case; see negative enterprise value stocks.
A short checklist before trusting the number
- If capital spending is large relative to depreciation or EBITDA, read EV/EBIT and EV/free cash flow alongside.
- If the company reports adjusted EBITDA, rebuild it from net income and list every item you chose to keep or reject.
- If net debt is above 3 to 4 times EBITDA, check maturities, covenants and interest cost before reading the multiple as cheap.
- If the business is cyclical, compare current EBITDA with its average over the last full cycle.
- If leases are large, decide whether you are using EBITDA or EBITDAR and match enterprise value to it.
Dombey's published research checks EBITDA against capital spending and cash conversion before each catalyst; see the research archive.
The bottom line
EV/EBITDA prices the whole business against operating profit before interest, tax and non-cash charges, which makes it a fair first comparison across companies with different balance sheets. Its blind spots are the costs it leaves out: capital spending, working capital, stock-based compensation, interest and tax. Treat a low multiple as the start of the work, rebuild EBITDA from the filings, and read it next to EV/EBIT, free cash flow and leverage before drawing a conclusion.