

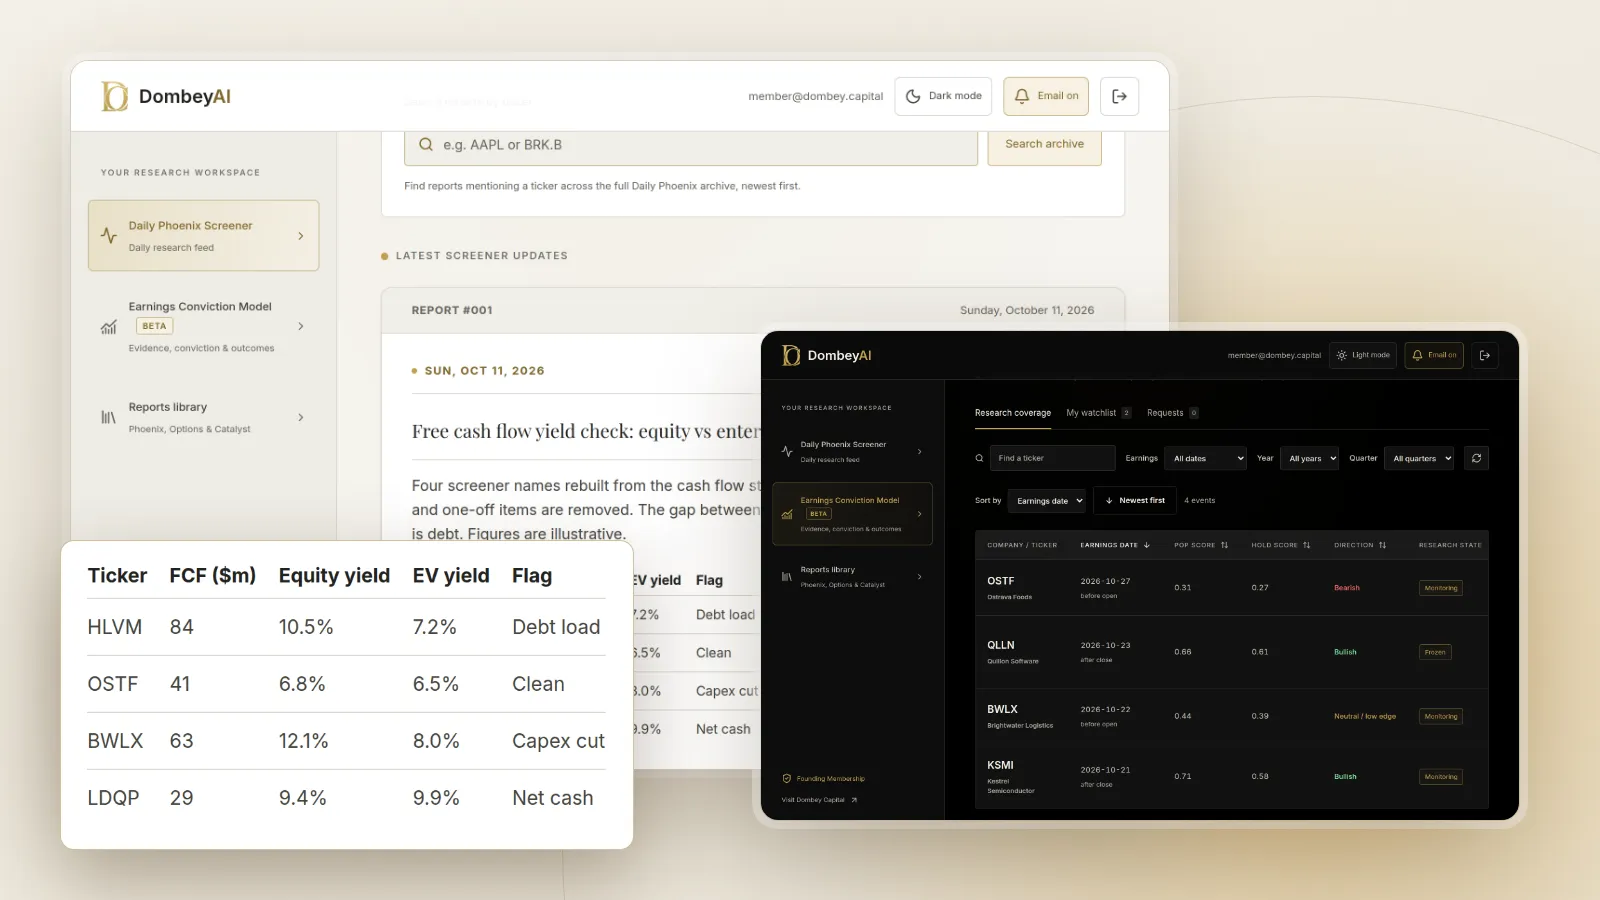
The free cash flow yield formula
There are two versions. Each pairs a cash flow figure with the value of the claims that cash belongs to.
Equity free cash flow yield = (cash from operations minus capital expenditures) / market capitalization
Enterprise free cash flow yield = unlevered free cash flow / enterprise value
The equity version is the one most screens show. Cash from operations already has interest paid taken out, so what remains after capital spending belongs to shareholders. Dividing it by market cap gives the cash return on the equity at today's price.
The enterprise version starts from cash before interest. A common shortcut is cash from operations plus after-tax interest paid, minus capital expenditures. That figure belongs to lenders and shareholders together, so it pairs with enterprise value, which counts debt and subtracts cash. Our guide on how to calculate enterprise value walks through that denominator line by line.
Why investors use it
Accounting earnings and cash can drift far apart. Net income includes depreciation, which is a non-cash charge, and excludes the cash a company actually spends on equipment, software and buildings. It also moves with accruals: revenue booked but not yet collected, or expenses recognized before they are paid.
Free cash flow cuts through most of that. It is the cash that came in from running the business, minus the cash spent to maintain and grow it. A yield built on it answers a practical question: if this company kept producing cash at this rate, how many years would it take to earn back today's price?
It also reads naturally against interest rates. A free cash flow yield of 3% when Treasury bills pay more implies the market expects that cash to grow. A yield of 12% on a stable business implies the market doubts the cash will last, or is not paying attention. Either way, the gap is the thing to explain.
Compared with forward and trailing P/E, the yield is harder to flatter with adjusted earnings, because it starts from the cash flow statement. It is not immune to distortion, as the sections below show.
A worked example
The figures below are illustrative. Company A and Company B are hypothetical.
| Line | Company A | Company B |
|---|---|---|
| Cash from operations (trailing twelve months) | $120m | $120m |
| Capital expenditures | ($40m) | ($95m) |
| Free cash flow | $80m | $25m |
| Market capitalization | $800m | $800m |
| Equity free cash flow yield | 10.0% | 3.1% |
| Net debt | $0m | $400m |
| Enterprise value | $800m | $1,200m |
Both companies report the same cash from operations and trade at the same market cap. On a P/E ratio they might look alike. Company A keeps two thirds of its operating cash after capital spending; Company B spends most of it. Company B also carries $400 million of net debt, which makes its enterprise yield lower still.
Adjustments that change the answer
Free cash flow has no single definition. SEC staff guidance on non-GAAP measures says as much, and it requires companies that report the measure in filings to describe how they calculated it and to reconcile it to cash from operations. The same guidance says free cash flow, as a liquidity measure, must not be presented on a per-share basis in those filings. That is one reason to rebuild the figure yourself rather than copy a headline number.
These are the adjustments that matter most.
- Stock-based compensation. It is added back in cash from operations because no cash leaves the company. It still costs shareholders through dilution. Subtracting it, or tracking the growth in the diluted share count, gives a truer yield.
- Working capital. A company that collects receivables faster or stretches payables in one year gets a one-time lift to cash from operations. Look at receivables, inventory and payables on the balance sheet and ask whether the change can repeat.
- Maintenance versus growth capital spending. Total capital expenditures mix the spending needed to stand still with spending on expansion. Some investors estimate maintenance spending, using depreciation as a rough guide, to see what the business would produce without growth. Others keep total spending to stay conservative.
- Underinvestment. A company can raise free cash flow for a few years by cutting capital spending below depreciation. The yield looks high until the equipment wears out.
- One-off items. Tax refunds, legal settlements, insurance proceeds and asset sales can land in cash from operations or nearby. Strip them out of a trailing figure.
- Leases and acquisitions. Principal payments on finance leases sit in financing activities, and cash spent buying companies sits in investing activities outside capital expenditures. For a company that grows by acquisition, ignoring that spending overstates free cash flow.
- Timing. Use trailing twelve months from the last four quarters, not a single strong quarter multiplied by four. The 10-Q gives year-to-date cash flow figures, so subtract the prior year's matching period and add the last full year.
Free cash flow yield in special situations
Event-driven work often involves companies whose recent cash flow is unrepresentative: a spin-off with new standalone costs, a company emerging from restructuring, or one in the middle of selling a division. The yield still helps, as long as you ask what the cash flow will look like after the event, not before it.
- If a company is about to separate a business, rebuild free cash flow for the part you would own, including the corporate costs it will now carry alone.
- If free cash flow is negative, switch to a cash runway estimate; the yield has nothing to say about how long the cash lasts.
- If the company has large debt coming due, read the yield next to the maturity schedule; cash that must repay a loan is not available to shareholders. Our piece on debt maturity walls covers that check.
- If the company holds a lot of cash, compare the yield on market cap with the yield on enterprise value. A big gap means much of the price is the cash itself, which links to net cash per share.
- If a high yield comes with a plan to spend it on acquisitions, discount it until you see what the acquisitions earn.
Dombey's published research rebuilds free cash flow from the filings before each catalyst; see the research archive.
Where this goes wrong
Common mistakes:
- Trusting a screen's number. Data vendors define free cash flow differently, and some mix levered and unlevered figures. Check the inputs before ranking stocks on the output.
- Reading a cyclical peak as normal. A commodity or industrial company near the top of its cycle can show a very high yield just before cash flow drops. Average across a full cycle instead.
- Ignoring dilution. A company that pays employees heavily in stock can show strong free cash flow while the share count rises every year. The cash per share you own grows more slowly than the headline.
- Forgetting where the cash goes. Free cash flow only benefits shareholders if it is returned, used to pay down debt, or reinvested at a good return. Cash that sits in a subsidiary abroad or funds poor acquisitions is worth less.
- Applying it to the wrong business. For banks and insurers, operating cash flow mixes in customer deposits and policy flows, so free cash flow yield says little. Use book value measures instead.
- Mixing numerators and denominators. The single most common error is unlevered cash over market cap. It makes indebted companies look cheaper than they are.
Quick reference: which yield to use
| Situation | Use | Why |
|---|---|---|
| Little or no debt | Equity yield | Levered and unlevered figures are close |
| Large debt load | Enterprise yield | Equity yield ignores what lenders are owed |
| Comparing peers with different debt | Enterprise yield | Removes the effect of financing choices |
| Judging what shareholders receive | Equity yield | Cash after interest is theirs |
| Negative free cash flow | Cash runway instead | The yield is not meaningful |
| Low-margin, high-revenue business | Read with price to sales | Small margin changes move the yield sharply |
The bottom line
Free cash flow yield divides the cash a business produces after capital spending by what you pay for it. Use levered free cash flow over market cap for the shareholder view and unlevered free cash flow over enterprise value to compare companies with different debt. Rebuild the figure from the cash flow statement, adjust for stock compensation, working capital and one-off items, and look at several years rather than one. A high yield is worth investigating; the work is in showing the cash will keep coming and reach shareholders.