

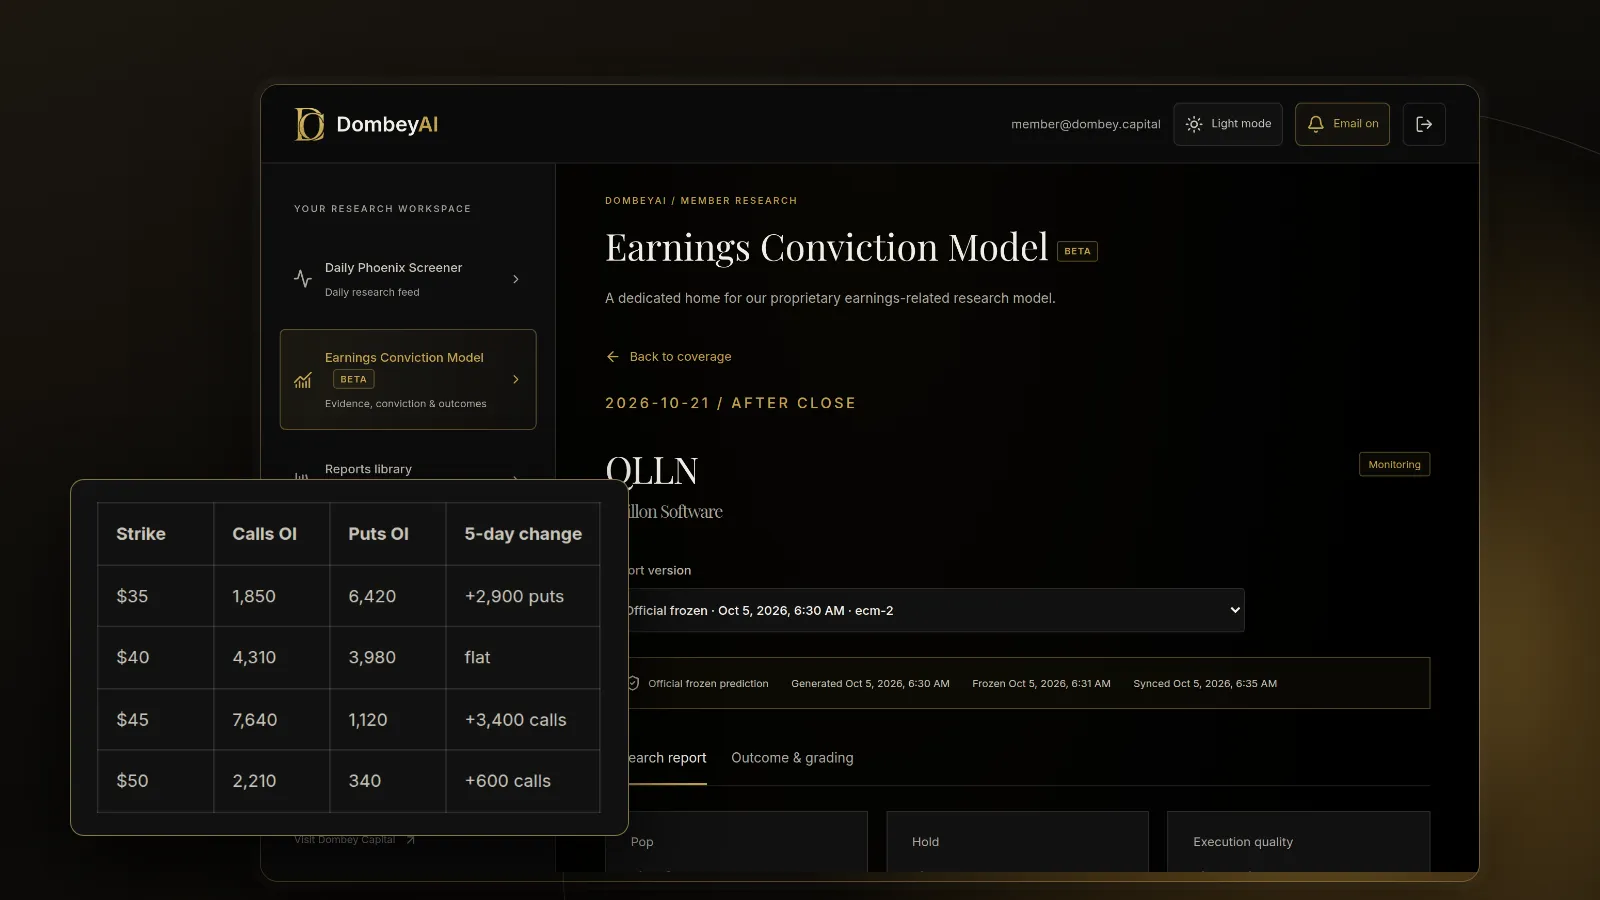
What open interest counts
Every listed option contract has two sides: a holder who bought it and a writer who sold it. When the two open a new position against each other, one contract of open interest is created. That contract stays in the count until it is closed by an offsetting trade, exercised and assigned, or expires.
FINRA defines open interest as the number of outstanding contracts in a particular options market or contract. A standard equity option covers 100 shares, so 5,000 contracts of open interest at one strike represent options on 500,000 shares.
Open interest is reported per contract (one strike, one expiry, call or put) and can be summed across strikes, expiries or the whole stock. The per-contract figures are the useful ones before a catalyst. A stock-wide total mixes positions that have nothing to do with the event.
How open interest changes
Whether a trade changes open interest depends on whether each side is opening or closing a position.
| Buyer is | Seller is | Effect on open interest |
|---|---|---|
| Opening a new long | Opening a new short | Rises by the number of contracts |
| Opening a new long | Closing an existing long | No change |
| Closing an existing short | Opening a new short | No change |
| Closing an existing short | Closing an existing long | Falls by the number of contracts |
Exercise, assignment and expiration also reduce open interest. On the day an expiry passes, its open interest drops to zero.
Open interest versus volume
Volume is the number of contracts that traded during a session. Open interest is the number still open after it. The two answer different questions.
- Volume shows activity. A contract can change hands ten times in a day and add ten to volume.
- Open interest shows positioning. Those ten trades might create, close or pass along the same position and leave open interest unchanged.
Open interest is generally calculated after the close and published once a day. During a session, the figure on a chain reflects the prior day. That lag matters before a catalyst: positions opened today will not show until tomorrow, and positions opened and closed within one day never show at all.
Comparing the two is often more useful than either alone. Volume that is large relative to existing open interest at a strike is new activity worth checking the next day. If open interest then rises by a similar amount, the activity was mostly opening trades. If it does not, the trades were mostly closing or passing positions between traders.
A worked example
Open interest rose by 3,400 contracts on volume of 4,000. Most of Monday's trades opened new positions on both sides. That is the factual read. Several stories fit it:
- Traders bought calls to speculate on a move above $45 after the report, and market makers sold them.
- Holders of the stock sold calls against their shares to collect premium, and other traders bought them.
- A fund that is short the stock bought calls to cap its loss if the report is strong.
Each story has a different meaning for the stock. Price and implied volatility help separate them. If the call's price and implied volatility rose through the day while volume printed near the ask, buyers were more likely the aggressive side. If prices drifted lower with prints near the bid, sellers were. Neither check is conclusive; a single block trade can look like either.
Now suppose that by Thursday, two days before the report, open interest on the $45 call has fallen back to 2,000 while the $50 call on the same expiry has risen by a similar amount. That pattern often reflects a roll: traders closing one strike and opening another. The total position did not shrink; it moved.
How to read open interest before a catalyst
The goal is to understand what is already positioned, not to predict the result. A short routine:
- Pick the right expiry. Use the first expiry after the event date. Positions there are the ones tied to the catalyst. Check the date on the catalyst calendar first so you do not read an expiry that settles before the event.
- Map open interest by strike. Note the strikes with the largest call and put open interest, and how far they sit from the current price.
- Track the change, not the level. Record open interest each day for a week or two before the event. Steady building at a few strikes says more than one large legacy position opened months ago.
- Compare with volume. Large volume that does not raise open interest is churn or closing. Large volume that does raise it is new positioning.
- Read implied volatility next to it. Rising open interest with rising implied volatility suggests demand for options; rising open interest with falling implied volatility suggests supply, often from writers.
- Price the implied move. The at-the-money straddle on that expiry shows the size of move the market charges for. Compare where open interest sits with that range. Our guide on estimating an earnings move from options covers the arithmetic.
- Check the stock side. Short interest, recent 13D filings and insider activity can explain option positions as hedges. See the best short interest data tools for where to find borrowing data.
The same routine applies to catalysts other than earnings: a merger vote, a court ruling, a shareholder vote or a regulatory decision. Any event with a known date tends to pull positions into the first expiry after it.
Common patterns and what they may mean
- If call open interest builds well above the current price on the first post-event expiry, with rising implied volatility, traders may be paying for upside exposure. It may also be short sellers buying protection.
- If put open interest builds below the current price while the stock is steady, holders may be hedging long stock into the event rather than betting on a decline.
- If open interest is concentrated at one strike near the current price on an expiry just after the event, dealer hedging around that strike can matter in the final days before expiry. How much depends on whether dealers are net long or short, which public data does not show.
- If open interest is large but has not changed for weeks, it is likely old positioning and may say little about the coming event.
- If volume spikes but open interest the next day is flat, the activity was mostly traders closing or swapping existing positions.
Where this goes wrong
Assuming a side. Open interest has no direction. Every long has a matching short. Calling a large call position "bullish" assumes you know which side is the speculator, and often you do not.
Reading a stale number. Open interest is a prior-day figure. On the morning of a report, the chain may not reflect positions put on the day before it.
Ignoring hedges and spreads. Many positions are one leg of a spread or a hedge against stock. A large put position may be the protective leg of a fund that owns the shares.
Treating "max pain" as a forecast. Max pain is the strike at which option holders in aggregate would lose the most at expiry. The idea that stocks gravitate there is a popular claim, not an established rule. A dated catalyst can move a stock well away from any strike.
Overweighting thin markets. On smaller companies, a single trader can create most of the open interest at a strike. One position is not a crowd.
Mixing expiries. Totals across all expiries blend positions taken for different reasons. Before a catalyst, the expiry just after the event is the one that matters most.
Dombey's weekly Options Research reviews positioning around dated catalysts alongside the risks; see the research archive.
The bottom line
Open interest is the number of option contracts still open, and it changes only when positions are created or closed, not with every trade. Before a catalyst, read it by strike on the first expiry after the event, track how it changes day by day, and compare it with volume, implied volatility and the implied move. It shows where positions sit, not which way they lean or how the event will turn out. Options trading carries substantial risk; this article is education, not a recommendation.