

How implied volatility works
An option's price depends on six inputs: the stock price, the strike, the time to expiry, interest rates, dividends and volatility. The first five are known. Volatility is the only one that has to be estimated, so the market's price for the option effectively sets it.
A model such as Black-Scholes turns those inputs into a theoretical price. Implied volatility runs the model the other way. If a call trades at $2.40, the volatility that makes the model return $2.40 is that option's implied volatility. There is no formula that solves for it directly, so brokers and data tools search for it numerically.
Three properties follow from this:
- It is a price, not a measurement. Implied volatility tells you what traders are paying, not what will happen. It includes demand for protection, fear of a known event and the cost of carrying risk for market makers.
- It is annualized. A 40% implied volatility on a one-week option still refers to a one-year scale. You have to convert it to read it over a shorter period.
- Every option has its own. Each strike and expiry has a separate implied volatility. A single "IV" number for a stock is usually the at-the-money option in a chosen expiry, or a blend.
From implied volatility to an expected move
Because implied volatility is an annualized standard deviation, you can scale it to any period with the square root of time. The rough formula for a one standard deviation move is:
Expected move = stock price x implied volatility x square root of (days to expiry / 365)
Under the model's assumptions, the stock finishes within one standard deviation of today's price about two thirds of the time. Real returns have fatter tails than the model assumes, so treat this as a sizing guide, not a probability you can rely on.
For earnings, traders often read the expected move straight from the at-the-money straddle in the first expiry after the report. Our guide to estimating an earnings move from options walks through that method step by step.
Quick reference: how to read implied volatility
| Measure | What it tells you | Where it misleads |
|---|---|---|
| At-the-money IV | The market's price for movement over one expiry | Mixes event risk with ordinary daily risk |
| IV rank (0 to 100) | Where today's IV sits within its range over a lookback, often one year | A single spike in the lookback compresses every later reading |
| IV percentile | Share of days in the lookback with lower IV | Ignores how far above those days today is |
| Term structure | IV across expiries, near to far | An event in one expiry distorts the curve |
| Skew | IV across strikes in one expiry | Normal for puts to cost more; only changes in skew carry news |
| IV minus realized volatility | Whether options are priced above or below recent movement | Past movement may not reflect a coming event |
Implied volatility and dated catalysts
Implied volatility is where the calendar shows up in option prices. When a company has a known event ahead, such as an earnings report, a court ruling, an FDA decision or a shareholder vote, options that expire after the event carry that risk and trade at higher implied volatility than options that expire before it.
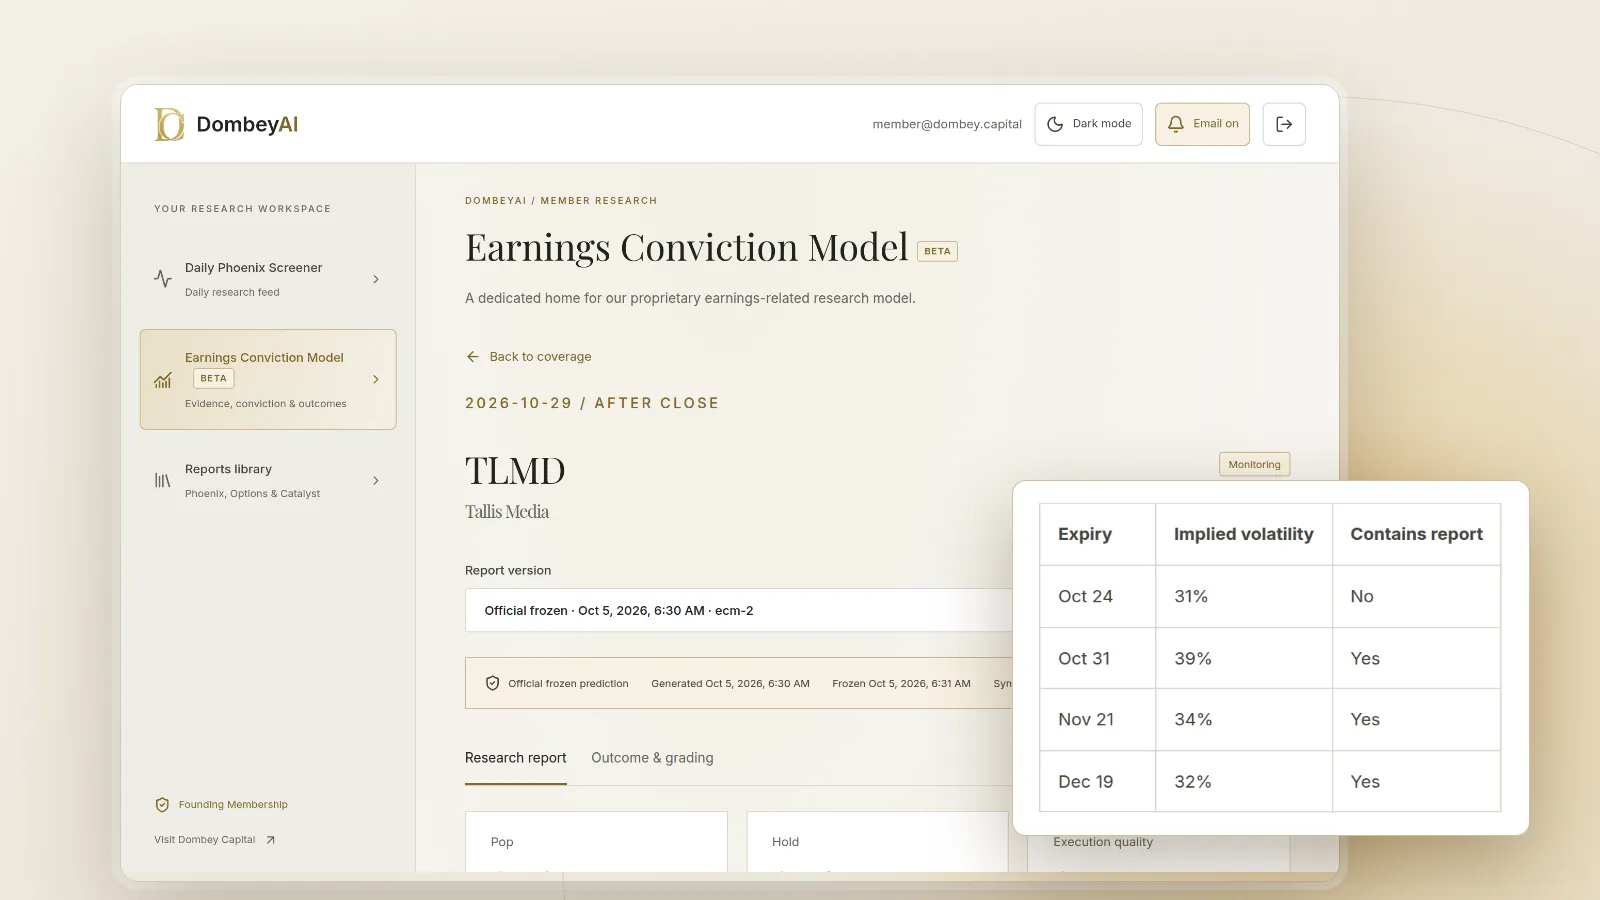
You can see this in the term structure. Normally longer-dated options carry similar or slightly higher implied volatility than shorter ones. Ahead of an event, the first expiry after the event jumps above its neighbors. The size of that jump is the market's price for the event itself.
A common way to isolate it is to compare the implied variance of the expiry that contains the event with the expiry before it. The difference, converted back into a one-day move, is the event's implied move. It is the cleanest way to ask whether the options price more risk than the stock's history of reactions suggests. We cover the preparation side in what an earnings catalyst is.
After the event
Once the event passes, the uncertainty it carried is gone. The expiry that held it reprices as if every remaining day were ordinary, and implied volatility drops, often by a large amount in a single session. That drop is IV crush, and it is why a call buyer can be right about direction and still lose money. Our explainer on IV crush covers the mechanics.
Special situations behave differently from earnings. In an announced cash takeover, implied volatility on the target usually collapses because the price is pinned near the offer. If the deal is at risk, put implied volatility can stay elevated, because the downside to the undisturbed price is large. Merger arbitrage investors often watch the target's options for this reason.
Skew and term structure
Two shapes tell you more than any single number.
Skew is how implied volatility varies across strikes. In most stocks, out-of-the-money puts carry higher implied volatility than equally distant calls, because investors pay up for protection. Some stocks, often small biotech names waiting on a binary event, show the reverse. A sudden change in skew, such as puts getting much more expensive in a week with no news, can be a signal worth checking against the filings.
Term structure is how implied volatility varies across expiries. An upward-sloping curve is common in calm markets. An inverted curve, where near-term options carry more implied volatility than longer ones, usually means a near-term event or stress.
Implied volatility versus realized volatility
Realized volatility is what the stock actually did, measured as the annualized standard deviation of its daily returns over a past window. Comparing it with implied volatility answers a practical question: are options priced above or below the movement the stock has been delivering?
- If implied volatility sits well above recent realized volatility and no event is scheduled, options look expensive relative to history. Check the news and filings before assuming the market is wrong.
- If implied volatility sits above realized volatility only because an earnings date falls inside the expiry, the gap is expected. Compare the implied event move with past reactions instead.
- If implied volatility sits below realized volatility, options are priced for a calmer stock than the recent one. That can happen after a volatile period the market thinks is over.
Where this goes wrong
- Treating implied volatility as a forecast. It is a market price that includes a premium for risk. Over long periods, implied volatility has tended to sit above the volatility that followed, which is one reason option sellers exist. That does not make selling safe; the losses when it is wrong are large.
- Forgetting the event. A stock's implied volatility looks high on a chart for weeks before earnings and collapses after. Calling it "high" without checking the calendar leads to bad comparisons.
- Reading one number. A headline IV figure hides skew and term structure, which often carry the actual information.
- Thin markets. In small, illiquid stocks the bid-ask spread on options can be wide enough that the implied volatility from the mid price means little. Check the spread and open interest first.
- Model assumptions. Pricing models assume continuous trading and a lognormal distribution. Stocks gap, especially on binary catalysts, so a one standard deviation range understates the chance of a large move.
How to use it in research
Implied volatility is most useful as a cross-check on your own view of an event. If your work on a company says a coming catalyst is lower risk than the options price, the options may be overpricing it; if the options are calm ahead of an event you think is binary, they may be underpricing it. Either way, the next step is the primary documents: the filings, the timeline and the terms. Dombey's published research reads option pricing alongside the catalyst and the filings before each event; see the research archive.
For tools that show implied volatility history, term structure and earnings moves, see our comparison of options analysis tools for earnings.
The bottom line
Implied volatility is the volatility an option's price implies, quoted on an annual scale and backed out of a pricing model. Scale it by the square root of time to get an expected move, and read it alongside the calendar, the skew and the term structure. It rises into dated events and falls once they pass, which is the source of IV crush. Treat it as the market's price for movement, then judge that price against the stock's history and your own reading of the catalyst.