

How the put-call ratio is calculated
The formula is a single division:
Put-call ratio = puts ÷ calls
What changes is what you count and over which set of options.
- Volume ratio. Put contracts traded in a session divided by call contracts traded in the same session. It reacts to the day's activity.
- Open interest ratio. Put contracts still open divided by call contracts still open. It reflects positions built over weeks and moves more slowly. Our article on open interest explains how those positions are created and closed.
- Premium-weighted ratio. Dollars paid for puts divided by dollars paid for calls. It gives more weight to expensive contracts and less to cheap far out-of-the-money ones.
You can compute any of these for one stock, one expiry, an index or the whole listed market. Cboe publishes daily total, index, equity, exchange traded product and VIX put-call ratios on its market statistics pages. For a single stock, most option chains show put and call volume and open interest, so the ratio takes a few seconds to work out.
A standard equity option covers 100 shares, so a ratio built from contract counts is also a ratio of the share exposure behind them, as long as every contract is standard size.
Quick reference: versions of the ratio
| Version | What it counts | Moves | Best used for |
|---|---|---|---|
| Market-wide volume | All puts and calls traded today | Daily, noisy | Broad sentiment, compared with its own history |
| Equity only | Single-stock options | Daily | Trader sentiment, less hedge-driven than index |
| Index only | Index options | Daily | Institutional hedging demand |
| Single-stock open interest | Open puts and calls on one stock | Slowly | Positioning before a catalyst |
| Single-expiry ratio | One expiry on one stock | Around the event | What is set up for a dated event |
What a reading means
The literal meaning is narrow. A ratio of 1.5 on a stock's volume means that for every 100 calls traded that day, 150 puts traded. That is all.
Three things the number does not tell you:
- Which side was aggressive. Every contract has a buyer and a seller. A high put volume can mean traders bought puts or sold them.
- Whether the trade opened or closed a position. Volume counts both. A day of heavy put volume may be traders closing puts they already held.
- Why the trade was made. A put can be a bet on a decline, a hedge on long stock, one leg of a spread or the protective leg of a merger arbitrage position.
So the ratio is a starting question, not an answer. The work is in finding out what sits behind it.
Two common readings: sentiment and contrarian
Traders use the ratio in two opposite ways.
The direct reading treats more puts as more bearish and more calls as more bullish. It works best when the activity is clearly opening and clearly bought at the ask, which the ratio alone cannot confirm.
The contrarian reading applies mainly to market-wide ratios. The idea is that crowds buy protection after declines and chase calls after rallies, so an unusually high market ratio marks fear that may be near its peak, and an unusually low one marks complacency. This is a popular framework, not an established rule, and it is a weak timing tool. Extreme readings can persist, and a market can keep falling while the ratio stays high.
Both readings depend on knowing the normal range. Index ratios commonly run above equity ratios because institutions buy index puts to hedge portfolios. A level that is unusual for one series is ordinary for another. Compare each series with its own history over several months, and look at the change, not the level.
How to read it before a catalyst
Before an earnings report, a shareholder vote or a regulatory decision, the market-wide ratio matters little. The single-stock ratio on the expiry just after the event matters more. A short routine:
- Pick the expiry. Use the first expiry after the event date. Positions there are the ones tied to the catalyst.
- Compute both ratios. Volume ratio for today, open interest ratio for what has built up. If they disagree, today's trading may be closing or rolling positions.
- Look at strikes. Note where put and call open interest sits relative to the current price and to the move priced by the at-the-money straddle. Puts far below the priced range are usually cheap crash protection.
- Check premium and implied volatility. Rising put prices and rising implied volatility on puts suggest buyers are paying up. Falling prices suggest sellers are supplying them.
- Check the stock side. High short interest can explain heavy call buying as short sellers capping risk. See the best short interest data tools for where to find it.
- Compare with past events. If the stock's ratio rose to a similar level before each of its last four reports, this reading is routine.
Our guide on estimating an earnings move from options covers the straddle arithmetic, and the earnings catalyst primer covers the rest of the preparation.
A worked example
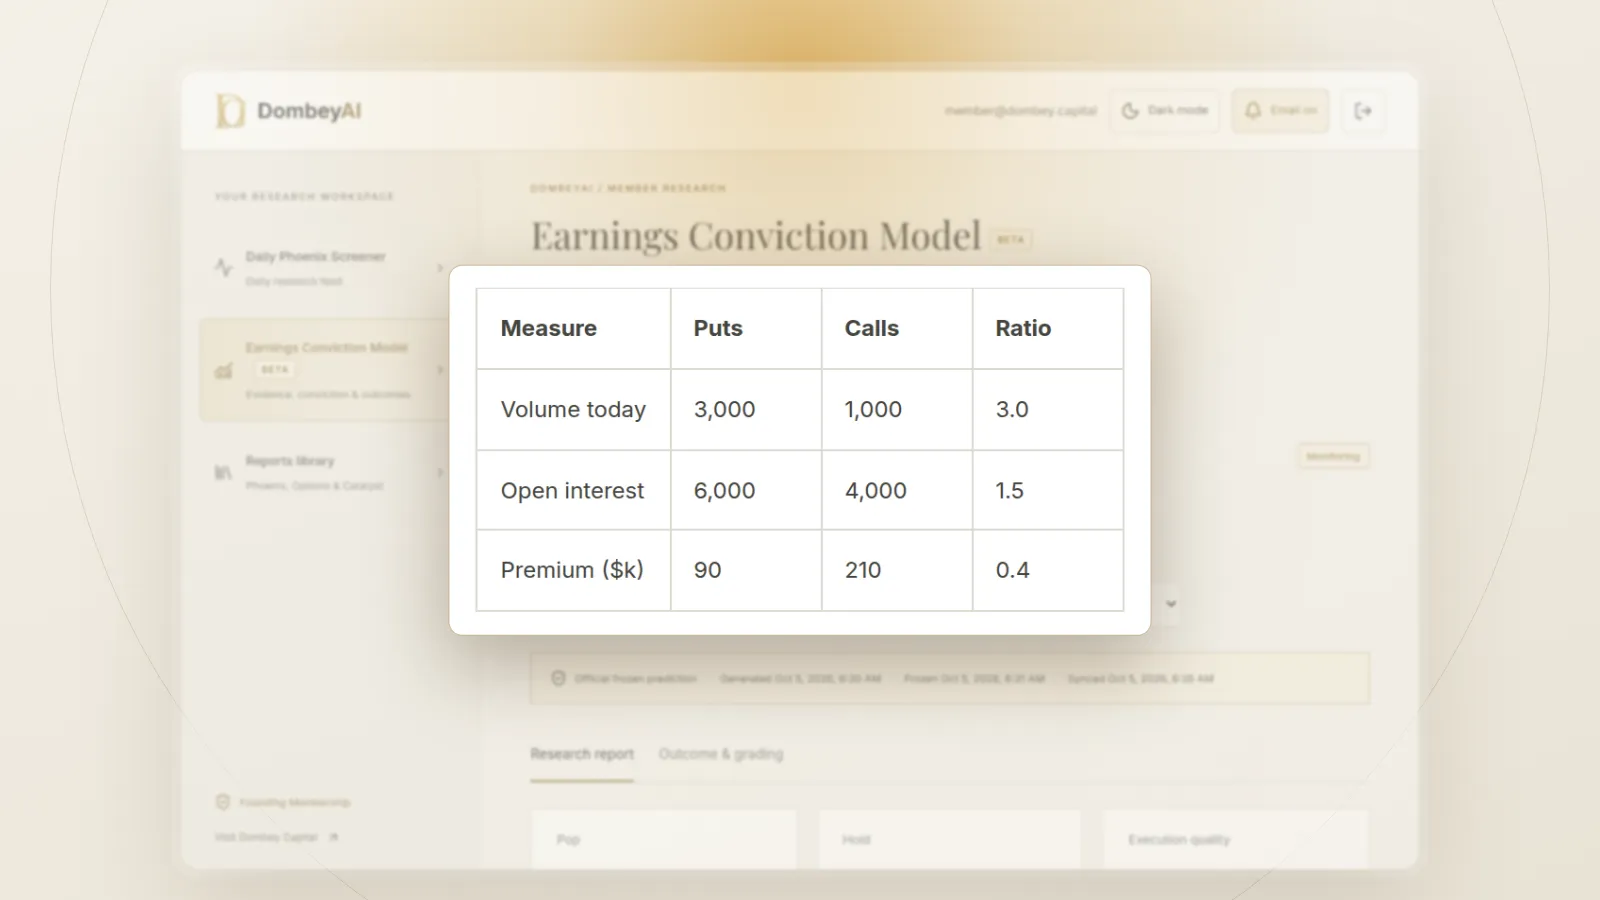
A volume ratio of 3.0 looks bearish at first sight. Now look behind it.
- Nearly all 3,000 puts traded at the $40 strike, 20% below the stock, for about $0.30 each. That is roughly $90,000 in premium.
- The 1,000 calls traded at the $52.50 strike for about $2.10 each. That is roughly $210,000 in premium.
- The at-the-money straddle costs $4.50, so the market prices a move of about 9% in either direction. The $40 puts sit well outside that range.
- Tomorrow's open interest shows the $40 puts up by 2,300 contracts. The calls are up by 900.
Counted by contracts, puts outnumber calls three to one. Counted by premium, calls outweigh puts more than two to one. The large put trade looks like cheap protection, probably bought by a holder of the stock, while more money went into calls near the current price. The volume ratio pointed one way; the premium pointed the other. Neither tells you how the report will go.
How to use it: a decision list
- If the market-wide ratio is at an extreme for its own history, treat it as context about crowd positioning, not as a timing signal.
- If a single stock's ratio jumps before a catalyst, check strikes, premium and the next day's open interest before reading anything into it.
- If the volume ratio is high but open interest does not rise, the activity was likely closing or rolling existing positions.
- If most put volume sits far out of the money and costs little, it is probably protection, not a directional bet.
- If the stock has a pending merger or a large holder, expect hedging flows that keep the ratio high for reasons unrelated to the outlook.
Where this goes wrong
Assuming a direction. The ratio counts contracts, not intent. Every put bought was sold by someone, and you rarely know which side started the trade.
Using a fixed threshold. Rules like "above 1 is bearish" ignore that each series has its own normal level. An index ratio above 1 can be routine.
Ignoring hedges and spreads. Collars, put spreads, covered calls and merger arbitrage hedges all add contracts to one side for reasons that have nothing to do with the stock's outlook.
Counting contracts, not dollars. A thousand cheap puts and a thousand expensive calls produce a ratio of 1.0, yet the money is mostly on one side.
Letting one trade decide. On smaller companies, one block can set the day's ratio. One position is not a crowd.
Mixing expiries. A stock-wide ratio blends long-dated hedges with short-dated event trades. Before a catalyst, isolate the expiry just after the event.
Forgetting the timing of the data. Open interest is reported once a day for the prior session, so an open interest ratio on the morning of an event can miss yesterday's positioning. After the event, IV crush and expiry can change the ratio sharply with no change in anyone's view.
Dombey's weekly Options Research reviews positioning around dated catalysts alongside the risks; see the research archive.
Common mistakes
- Reading one day in isolation. A single session's ratio is noisy. Track it for a week or two before an event.
- Comparing a stock's ratio with the market's. They measure different populations and run at different levels.
- Skipping the strike map. The ratio hides where the puts and calls sit. Two stocks with the same ratio can have very different setups.
- Treating it as a forecast. It describes current positioning. It says nothing reliable about how a report, vote or ruling will turn out.
The bottom line
The put-call ratio divides puts by calls, using volume, open interest or premium, for a stock, an index or the whole market. It is a quick summary of how options activity is split, not a measure of who is bullish or bearish. Use market-wide ratios as context against their own history, and before a catalyst read the single-stock ratio on the first expiry after the event alongside strikes, premium, open interest and the implied move. Options trading carries substantial risk; this article is education, not a recommendation.