



Full disclosure: Dombey Capital is our own research service and our top pick here, for the reasons below. The section on where it falls short is there so you can judge whether it fits your process.
Quick comparison
| Tool | Best for | Key features | Price (as of October 2026) |
|---|---|---|---|
| Dombey Founding MembershipTop pick | Short interest inside special situations research | Weekly Phoenix Report, Daily Phoenix Screener, Biweekly Catalyst Briefing, Options Research, Earnings Conviction Model | Founding Membership $1,200/year; Standard Access $80/year or $8/month |
| FINRA short interest data | The official twice-monthly numbers | Exchange-listed and OTC equities, interactive grid, downloads, API, five rolling years | Free |
| ORTEX | Estimates between official reports | Short interest % of free float, cost to borrow, utilization, days to cover | Basic $49/month (delayed); Advanced $149/month (real-time) |
| S3 Partners | Institutional daily short data | Daily short interest on 65,000+ global securities, financing rates, Crowding and Squeeze Risk scores | See the vendor's pricing page (quote on request) |
| Finviz | Free screening on short float | Short Float filter, sortable and exportable; Elite alerts | Free; Elite $39.50/month or $299.50/year |
| MarketBeat | A sortable free tracker with days to cover | Shares short, change from prior report, days to cover, % of float | Free tracker; All Access $29/month or $249/year |
| Stock Analysis | A quick most-shorted list next to fundamentals | Top 100 by short % float, 300+ indicators in data tables on paid plans | Free; Pro $9.99/month or $79/year |
| ShortSqueeze.com | A wide short data spreadsheet | Days to cover, short % of float, short % change, squeeze ranking on sign-up | See the vendor's pricing page |
| HighShortInterest.com | A plain list above 20% short interest | Nasdaq, NYSE and AMEX stocks with short interest over 20%, float and shares outstanding | Free |
| SEC fails-to-deliver data | Settlement fails, checked against short claims | NSCC fails balances by settlement date since 2004 | Free |


How we compared these tools
We compared these tools from vendor documentation, pricing pages and public product pages read in October 2026. We did not run trials with any of them. Prices are as listed on each vendor's site on the day; where a page did not show a price, the table says so. We left out tools whose own sites we could not read that day.
| Criterion | Weight | What it measures |
|---|---|---|
| Source and freshness | 30% | Whether the figure is official or estimated, and how old it is when you see it |
| Borrow context | 20% | Cost to borrow, utilization and days to cover, not just short % of float |
| Catalyst context | 20% | Whether the tool helps place short positioning next to a dated event |
| Screening and alerts | 15% | Filtering across the market and notice when a watched name changes |
| Cost for the job | 15% | What it costs to follow short interest, not the whole platform |
If you trade around short squeezes day to day, weight freshness and borrow context higher and ORTEX and S3 Partners move up. If you only check short interest on companies you already research, FINRA and a free screener cover most of the job. We made no judgment on any vendor's accuracy, because we have no independent basis for one.
Quick picks by job
Best for short interest inside special situations research: Dombey Founding Membership
Heavy short interest in a spin-off, a recapitalization or a stock below net cash is a fact about positioning. The useful question is what event could force the shorts to act, and when. Founding Membership gives you written research and dated catalysts on the situations in Dombey's coverage. It does not publish short interest tables, so it works alongside FINRA or a screener.
Best official source: FINRA short interest data
FINRA's data is the number the other free tools repeat. It covers exchange-listed and OTC equities, with downloads and an API.
Best for estimates between official reports: ORTEX
ORTEX Advanced shows real-time short interest estimates with cost to borrow, utilization and days to cover, at a price an individual can pay.
Best for institutional desks: S3 Partners
S3 Partners sells daily global short interest, financing rates and crowding scores to buy-side and sell-side firms, through Bloomberg and data feeds.
Best free screen on short float: Finviz
Finviz's Short Float filter lets you sort and export the whole market by short interest relative to float, next to its other filters.
Best plain free list: HighShortInterest.com
One sortable page of stocks with short interest above 20%, with float and exchange.
Full reviews
1. Dombey Founding Membership (and Standard Access)
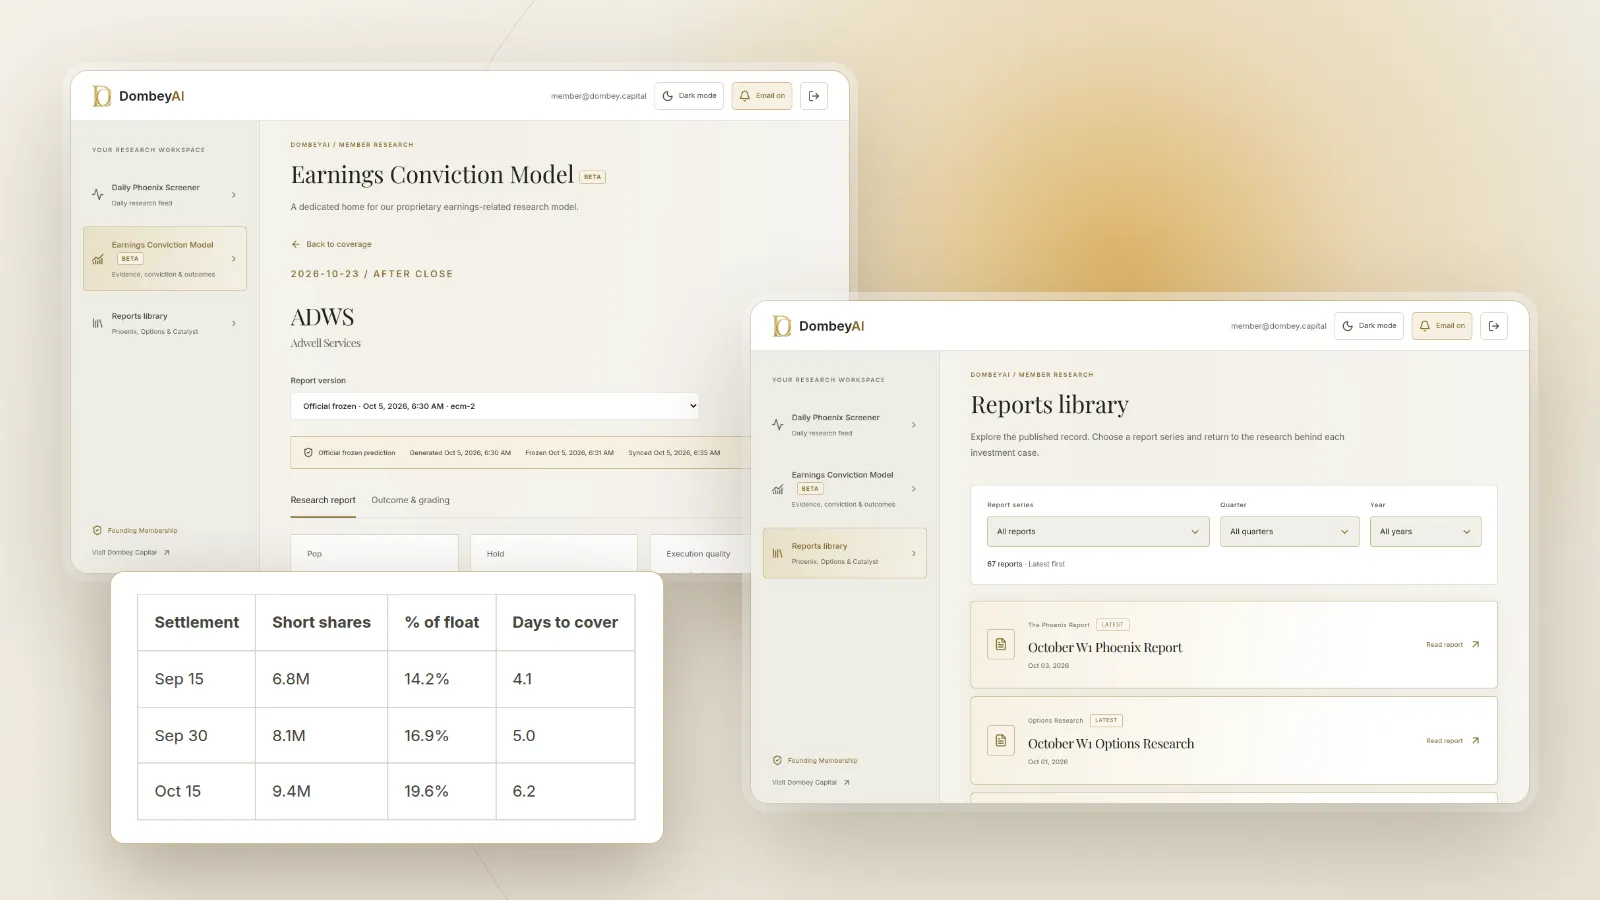
What it does. Founding Membership is Dombey's full research service: the weekly Phoenix Report on selected special situations and earnings-related opportunities, weekly Options Research, the Biweekly Catalyst Briefing, and the DombeyAI Portal with the Daily Phoenix Screener each trading morning and the Earnings Conviction Model. It also includes valuation and execution analysis and priority access. Standard Access, the lower-cost option, includes the Biweekly Catalyst Briefing and the complete public-research archive.
Best for. Readers who see heavy short interest in a special situation or ahead of earnings and want written research on the situation itself: the catalyst, its date, and what could undermine the case.
Pricing. Founding Membership is $1,200 a year, billed annually. Standard Access is $80 a year (about $6.67 a month) or $8 a month on monthly billing. The Public Archive is free.
Pros
- Places events such as earnings, deal votes and spin-off dates in written research with dates, which a short interest table does not do.
- Options Research adds derivatives context, useful when short positioning and options activity point the same way.
- Each thesis is published before its catalyst and kept in the archive.
Cons
- It does not publish short interest data, borrow rates or squeeze scores.
- Coverage is limited to the situations Dombey researches.
Verdict: Our top pick for readers who use short interest as one input into catalyst research. Pair it with FINRA or Finviz for the numbers.
2. FINRA short interest data
What it does. FINRA collects short positions from member firms under Rule 4560, twice a month: as of a mid-month settlement date (the 15th, or the previous business day) and an end-of-month settlement date (the last business day). Firms report by 6 p.m. Eastern on the second business day after the settlement date, and FINRA publishes on the seventh business day after it. Coverage includes all exchange-listed and OTC equity securities. Data is available in an interactive grid, downloadable files and an API covering five rolling years. FINRA also publishes daily short sale volume, which it describes as trades on each date, not positions held.
Best for. Confirming any short interest figure another site shows, and building your own history.
Pricing. Free.
Pros
- The primary source for US short interest, including OTC securities.
- Downloads and an API for your own analysis.
- The publication schedule is fixed, so you know when the next figure arrives.
Cons
- The figure is more than a week old on release.
- No borrow cost, utilization or float adjustment; you calculate ratios yourself.
Verdict: The reference number. Check it before trusting any other tool's figure.
3. ORTEX
What it does. ORTEX tracks short interest as a percentage of free float, cost to borrow (the annualized fee to borrow shares), utilization (the share of lendable stock out on loan) and days to cover. ORTEX Basic includes delayed short interest alongside analyst, insider and fundamentals data. ORTEX Advanced adds real-time short interest, options data, signals, stock scores and ORTEX AI.
Best for. Individual investors who want short interest estimates and borrow data between FINRA releases.
Pricing. ORTEX Basic is $49 a month. ORTEX Advanced is $149 a month.
Pros
- Cost to borrow and utilization show pressure on shorts that short % of float alone does not.
- Real-time estimates on Advanced fill the gap between official reports.
Cons
- Estimates are not the official figure and can differ from the next FINRA release.
- Real-time data needs the higher tier.
Verdict: The most accessible paid route to borrow data and short estimates between reports.
4. S3 Partners
What it does. S3 Partners sells daily global short interest across more than 65,000 securities, built from aggregated buy-side positions, securities lending data, exchange-reported interest and regulatory filings, with financing rates, float-adjusted utilization, days to cover and proprietary Crowded and Squeeze Risk scores. It is delivered through its Black app on Bloomberg and through data feeds.
Best for. Portfolio managers, trading desks, prime brokers and stock loan teams.
Pricing. Not listed. The site directs buyers to its sales team. See the vendor's pricing page.
Pros
- Daily and global coverage with financing detail.
- Crowding and squeeze risk scores built for screening and alerts.
Cons
- Built and priced for institutions; the Black app runs on Bloomberg.
- No published price.
Verdict: The institutional choice. Most individual investors will not need it.
5. Finviz
What it does. Finviz's screener includes a Short Float filter, defined as shares short divided by the float, which can be sorted and exported and appears in the ownership and snapshot views. Finviz Elite adds real-time data, advanced filters and alerts.
Best for. Investors who already screen on Finviz and want short float as one filter among valuation and technical ones.
Pricing. Free version available. Elite is $39.50 a month or $299.50 a year.
Pros
- Short float sits next to valuation, ownership and price filters in one screen.
- Sorting and export on the whole market.
Cons
- Short float only; no borrow cost or utilization.
- The figure inherits the delay of the official release.
Verdict: The simplest free way to screen the market on short interest. See our guide to the best stock screeners for value investors for its other uses.
6. MarketBeat
What it does. MarketBeat's short interest tracker shows shares sold short for the current and previous reporting period, dollar volume sold short, change from the previous report, days to cover, percentage of float shorted and percentage of total shares shorted. It updates on the semi-monthly reporting cycle. All Access adds extra filters and CSV export.
Best for. A free, sortable view of how short interest changed since the last report.
Pricing. The tracker is free. All Access is $29 a month or $249 a year.
Pros
- Change from the previous report is shown directly.
- Days to cover and percentage of float on one page.
Cons
- Export requires All Access.
- No borrow data.
Verdict: A clean free tracker for the trend between reports.
7. Stock Analysis
What it does. Stock Analysis publishes a list of the 100 most shorted stocks ranked by short % float, with price, change and market cap, next to its free financial statements and screener. Paid plans add saved screens and more than 300 indicators in data tables.
Best for. A quick most-shorted list for investors who already use the site for fundamentals.
Pricing. Free. Pro is $9.99 a month or $79 a year. Unlimited is $16.58 a month billed annually.
Pros
- Short interest sits beside financials, which helps judge whether a short case rests on the balance sheet.
- Low cost for the paid tier.
Cons
- The list page did not state its update frequency or source.
- Short float only; no days to cover on the list page.
Verdict: A useful starting list, best used with the financials on the same site.
8. ShortSqueeze.com
What it does. ShortSqueeze.com shows short interest data on more than 16,000 stocks across Nasdaq, NYSE, AMEX and OTC markets, including days to cover, shares short, short percent of float, short percent increase or decrease and insider and institutional ownership. Its Short Squeeze Ranking and daily short sale volume require sign-up.
Best for. Readers who want a wide spreadsheet of short metrics, including OTC names.
Pricing. The site did not show prices on the page we read. See the vendor's pricing page.
Pros
- Broad coverage including OTC stocks.
- Short change and ownership data side by side.
Cons
- The ranking and several fields need a subscription with no price shown.
- Quotes are delayed 20 minutes.
Verdict: Worth a look if you want breadth, after checking the price.
9. HighShortInterest.com
What it does. A single sortable database of Nasdaq, NYSE and AMEX stocks with short interest over 20%, showing short interest, float, shares outstanding and industry.
Best for. A fast, free list of heavily shorted stocks.
Pricing. Free.
Pros
- One page, no account needed.
- Filter by exchange.
Cons
- Only stocks above 20%, with no history or borrow data.
- The site frames high short interest around squeezes, which can push readers toward a one-variable view.
Verdict: A quick list to start from, not a research tool.
10. SEC fails-to-deliver data
What it does. The SEC publishes fails-to-deliver balances from the NSCC's Continuous Net Settlement system, with settlement date, CUSIP, ticker, issuer, price and total fails. The first half of a month is published at the end of the month and the second half around the 15th of the next month. The SEC states that fails-to-deliver are not necessarily the result of short selling and are not evidence of abusive or naked short selling.
Best for. Checking claims about settlement fails that often travel with short squeeze stories.
Pricing. Free.
Pros
- Official data back to 2004.
- Useful for testing a claim against the record.
Cons
- Not short interest, and easily misread as such.
- Raw text files with a delay.
Verdict: A specialist check, not a daily tool. Our SEC filing tools roundup covers the rest of the SEC's free data.
Where Dombey falls short
Dombey is the top pick for one job, and it is not a short interest tool:
- No short interest data. It does not publish short interest, borrow rates or squeeze scores. You need FINRA, ORTEX or a screener for that.
- Narrow coverage. It covers special situations in Dombey's research. A heavily shorted stock outside that coverage will not appear.
- No broad stock data terminal. There is no market-wide screener, API or data export.
- Small team and pen-name author. The research comes from a small team, and the byline is a pen name. Weigh it accordingly and check the numbers yourself.
- Short history. Its published record is short compared with the long-running data sites here.
Free vs paid
Free tools cover the official number. FINRA publishes it, and Finviz, MarketBeat, Stock Analysis and HighShortInterest.com put it in screens and lists. The SEC's fails-to-deliver data and FINRA's daily short sale volume add free context, as long as you remember neither is short interest.
Paid tools buy freshness and borrow context. ORTEX and S3 Partners estimate short positions between releases and add cost to borrow and utilization, which show how expensive it is to stay short. Finviz Elite and MarketBeat All Access add alerts, filters and export. Dombey's Founding Membership, and Standard Access as its lower-cost option, buy research on special situations, not more short data.
How to choose
| Your situation | Pick | Add later when |
|---|---|---|
| You follow special situations and want short positioning in context | Dombey Founding Membership, or Standard Access as the lower-cost option | You want the numbers: add FINRA and a free screener |
| You want the official figure for free | FINRA short interest data | You want it in a screen: add Finviz |
| You want estimates and borrow costs between reports | ORTEX | You run a desk: consider S3 Partners |
| You want a quick list of heavily shorted stocks | HighShortInterest.com or Stock Analysis | You want the trend: add MarketBeat |
| You want to check a fails-to-deliver claim | SEC fails-to-deliver data | You want positions, not fails: go back to FINRA |
- If a stock shows high short interest, check the settlement date of the figure before anything else.
- If the cost to borrow is rising with short interest, shorts are paying more to hold, which raises pressure ahead of an event.
- If days to cover is high and a dated catalyst sits inside that window, map both on a catalyst calendar.
- If the short case rests on the balance sheet, read the latest 10-Q before reading the squeeze story.
Where this goes wrong
Short interest is easy to misread. The official figure is stale by the time it is published. Float figures differ between vendors, so short % of float differs too. Estimates between releases are models, not reports. Shorts can be hedges against convertible bonds or merger positions, so a high number in a merger arbitrage situation may say little about anyone's view of the company. Heavy short interest can also be correct: shorts are often right. A squeeze needs a trigger, and the trigger is usually an event. None of these tools tells you whether it will come.
The bottom line
Dombey's Founding Membership is our top pick for readers who use short interest as one input into special situations and catalyst research, with Standard Access as the lower-cost option; it is research, not a short interest database. For the numbers, FINRA is the free official source, published twice a month with a delay of more than a week. ORTEX is the most accessible paid tool for estimates and borrow costs between releases, and S3 Partners serves institutions. Finviz and MarketBeat are the best free screens and trackers. Whatever you use, check the settlement date, the borrow cost and the next dated event before reading anything into the number.