

How tax-loss selling works
A capital loss only counts for tax purposes once it is realized, which means the position is sold. A stock bought at $40 and now trading at $25 carries a $15 paper loss per share. Sell it, and the $15 becomes a realized loss you report on Form 8949 and Schedule D.
The IRS rules that matter, from Topic 409 and Publication 550:
- Netting. Losses first offset gains of the same type: short-term losses against short-term gains, long-term against long-term. Short-term means held one year or less. Any net loss in one category then offsets net gain in the other.
- The $3,000 limit. If total losses exceed total gains, you can deduct up to $3,000 of the net loss against other income in the year ($1,500 if married filing separately).
- Carryover. Any net loss above that limit carries forward to later years, keeping its short-term or long-term character.
- Trade date. For stock sold on an exchange, the trade date, not the settlement date, determines the tax year. A loss sale on the last trading day of December counts for that year.
Tax-loss selling only matters in taxable brokerage accounts. Selling a loser inside an IRA or 401(k) produces no deduction.
The wash sale rule
Section 1091 of the Internal Revenue Code stops investors from selling for the deduction and buying straight back. A loss is disallowed if, within 30 days before or after the sale, you buy substantially identical stock or securities, or acquire a contract or option to buy them. That makes a 61-day window around the sale date.
A disallowed loss is not gone in most cases. It is added to the cost basis of the replacement shares, and the holding period of the old shares carries over, so the loss comes back when the new shares are sold. The exception is a repurchase inside an IRA. The IRS has ruled that a loss in a taxable account is disallowed when substantially identical stock is bought in the investor's IRA within the window, and the basis adjustment does not help because the IRA has no taxable basis.
| Rule | What it says | Where it comes from |
|---|---|---|
| Realization | A loss counts only when the position is sold | IRS Publication 550 |
| Trade date | Exchange sales count in the year of the trade date | IRS Publication 550 |
| Netting | Short-term and long-term losses offset gains of the same type first | IRS Topic 409 |
| Annual limit | Net capital loss deduction up to $3,000, or $1,500 married filing separately | IRS Topic 409 |
| Carryover | Unused net loss carries forward to future years | IRS Topic 409 |
| Wash sale window | No substantially identical purchase 30 days before or after the sale | 26 U.S.C. 1091 |
| IRA repurchase | Buying the same stock in an IRA within the window disallows the loss | IRS Publication 550 |
Why tax-loss selling moves prices
Most of the time, selling by individual holders is spread out and absorbed without much effect. Tax-loss selling is different in three ways.
It is concentrated in time. Individuals tend to review their accounts in November and December. Many mutual funds sell losers even earlier, because they measure capital gains for the excise tax distribution requirement over a year ending October 31.
It is concentrated in the same stocks. The stocks with the largest unrealized losses are, by definition, the year's worst performers. Many holders of the same name reach the same decision in the same weeks.
It is price-insensitive. A holder harvesting a loss cares about the tax result, not whether the price is fair. That is the same feature that makes index deletions create mispricing: the seller has a reason to sell that is unrelated to value.
The effect tends to be larger in small and thinly traded stocks, where a modest amount of extra supply can move the price, and where fewer professional buyers are watching. The reasons small companies absorb flows poorly are covered in why small caps misprice events more often.
The January effect
The January effect is the observed tendency for stocks, especially small caps and the prior year's losers, to do better in January than in other months. Researchers documented it in the 1970s and 1980s, including work by Rozeff and Kinney in 1976 and by Keim in 1983, and tax-loss selling was one of the leading explanations: sellers finish in December, the supply disappears, and prices that were pushed down by flows rather than fundamentals recover.
Three points belong next to that description.
- It is a tendency, not a rule. It has not appeared every year, and in some years the prior year's losers kept falling in January.
- It has weakened. Once a pattern is widely known, investors buy earlier to get ahead of it, which pulls any rebound into December and shrinks what is left for January.
- Tax-loss selling is only one explanation. Window dressing by fund managers, year-end bonus and pension inflows, and changes in risk appetite at the start of a year have all been proposed. They are hard to separate.
This article makes no claim about how large the January rebound is or how often it works. Treat the season as a dated supply event to understand, not a trade with known odds.
A worked example
Suppose a large share of its holders bought during the year at prices well above $12. From mid-November through the end of December, some of them sell to harvest losses. If that adds 150,000 shares a day of selling for six weeks, it is half of normal daily volume on top of ordinary trading, in a stock that most buyers are avoiding because it is down 60 percent.
Now consider one holder.
- Investor B bought 1,000 shares at $30 and sells at $12 on December 15, realizing an $18,000 short-term loss.
- Investor B has $10,000 of short-term gains for the year. The loss wipes those out, and $3,000 of the remaining $8,000 offsets ordinary income. The last $5,000 carries forward.
- If Investor B buys Company A again on January 10, that is 26 days after the sale, inside the window. The loss is disallowed and added to the basis of the new shares. To keep the 2026 deduction, the repurchase would need to come on or after January 15, more than 30 days later.
The question for an event-driven investor is not whether Company A will bounce. It is whether the December price reflects the business or the selling, and what the business is worth once the selling stops. That requires the same valuation work as any other situation, starting with checks such as net cash per share.
A timeline for tax-loss season
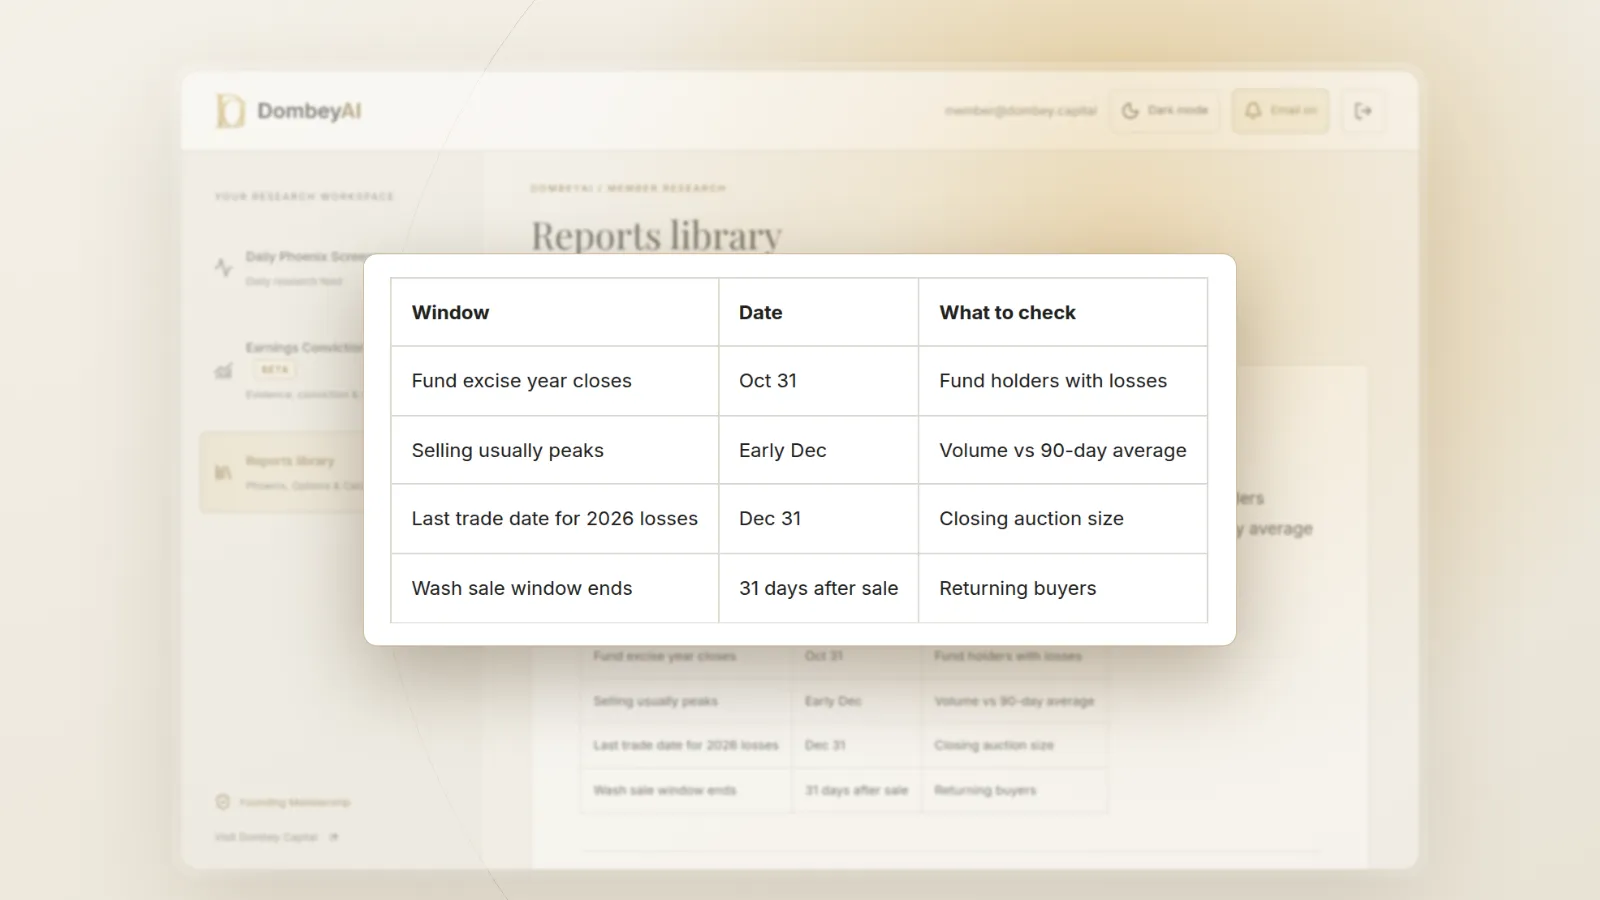
| When | Event | What to check |
|---|---|---|
| October | Many mutual funds close their excise tax year on October 31 | Which beaten-down names have heavy fund ownership |
| November | Individual investors begin year-end reviews | Volume relative to average in the year's worst performers |
| Early December | Selling often peaks in the weakest names | New 52-week lows with no new company news |
| Last trading day | Final day for 2026 losses on a trade-date basis | Closing auction volume |
| Early January | Selling pressure ends | Whether price recovers without new information |
| 31 days after sale | Wash sale window closes for December sellers | Repurchase demand from returning holders |
These dates fit on a catalyst calendar alongside earnings and other scheduled events, so the season does not arrive as a surprise. To see how stocks react to flows and news in practice, browse today's biggest stock moves.
Where this goes wrong
- Mistaking a broken business for a flow. Many of the year's losers fell for good reasons and keep falling. A stock pushed down by tax-loss selling and a value trap can look identical in December. The difference is in the filings, not the chart.
- Assuming January will repeat. The pattern is documented but inconsistent, and it has weakened as more investors know about it. Some years show little or no rebound.
- Arriving late. If enough buyers anticipate the bounce, it happens in December, and the January move is small or negative.
- Ignoring short interest. Heavy short positions in a weak stock can add volatility in either direction around year-end. Short interest and days to cover explains how to read them.
- Tripping the wash sale rule. Repurchases in another account, a spouse's account or an IRA, option purchases and dividend reinvestment can all disallow a loss you thought you had locked in.
- Letting the tax tail wag the dog. A $3,000 deduction against ordinary income is useful, but it does not justify selling a position you would otherwise keep, or holding one you would otherwise sell.
Dombey's published research treats year-end selling as one input among several when it reviews a beaten-down stock; see the research archive.
How tax-loss season fits with other catalysts
Tax-loss selling is a soft catalyst with a hard calendar, a mix explained in hard vs soft catalysts. The selling window is certain; the price effect is not. It often overlaps with other events: fourth-quarter guidance updates, index rebalances in December and year-end fund flows. A stock down sharply into December may be dealing with all of these at once, and it is rarely possible to attribute the move to one cause.
The bottom line
Tax-loss selling is selling losing stocks before year-end so the realized loss offsets gains and up to $3,000 of ordinary income, with the trade date setting the tax year and the 30-day wash sale rule limiting quick repurchases. Because the selling is concentrated in the same weak stocks at the same time, it can push prices below what the business alone justifies. The January effect is the documented tendency for some of that to reverse, but it does not hold every year and has weakened over time. The useful work is separating flow-driven weakness from real deterioration, and that work is done in the filings.
This article is education, not tax or investment advice. Tax situations vary, so check the rules that apply to you with a tax professional.