

What options liquidity means
A liquid option has buyers and sellers quoting close together, in size, and trading often. An illiquid one has a wide gap between bid and ask, small quoted size, little volume and an old last trade. Market makers quote most listed options, and they widen their quotes when hedging is harder, when the stock itself is thin, or when an event makes the next price move uncertain.
Five measures cover most of it:
- Spread as a percentage of the mid. The ask minus the bid, divided by the midpoint. This is the number to start with, because a $0.20 spread means little on a $10 option and a lot on a $0.50 one.
- Quoted size. How many contracts sit on the bid and the ask. A tight quote for one contract says less than a tight quote for 50.
- Volume. Contracts traded today and on a typical day.
- Open interest. Contracts still open, which shows positioning. Our explainer on open interest covers how to read it.
- Last trade time. When the contract last traded. On a thin chain the last price may predate today's move in the stock.
A standard equity option covers 100 shares, so a spread that looks small per share is 100 times larger per contract. An $0.80 spread is $80 per contract between the price you could buy at and the price you could sell at.
Why the mid price is the weak link
Most options analytics start from one price per contract. Chains and data vendors usually use the mid: the average of the bid and ask. When the spread is tight, the mid is close to where the option would actually trade. When it is wide, the option could trade anywhere between bid and ask, and the true clearing price is unknown.
Every derived number inherits that uncertainty. Implied volatility is solved from the option price, so a range of prices maps to a range of volatilities. The expected move comes from the at-the-money straddle, so a wide straddle gives a wide range of moves. Skew compares implied volatilities across strikes, so noise at each strike becomes a jagged curve. None of these numbers is wrong as arithmetic. The input is soft, and the output looks more precise than it is.
How wide spreads distort each signal
| Signal | How a wide spread distorts it | What to check first |
|---|---|---|
| Implied volatility | Mid can sit several vol points from where the option trades | IV at the bid and at the ask |
| Expected move | Straddle range is wide, so the move could be sized high or low | Straddle cost at bid, mid and ask |
| Skew | Each strike carries its own noise, so the curve looks jagged | Spread at each strike on the curve |
| Unusual activity | Trades print near the mid, so buyer or seller is unclear | Where the print sat in the quote |
| Put-call ratio | A few contracts swing the ratio on a thin chain | Raw volume and open interest behind it |
| IV crush after an event | Post-event spreads change, so the measured drop mixes in quote changes | Same-side prices before and after |
Implied volatility
Near the money, an option's price changes by its vega for each point of implied volatility. On a short-dated option on a low-priced stock, vega is small, often a few cents per point. That means a spread of under a dollar can span ten points of volatility or more. Two platforms using slightly different quote snapshots can show readings far apart for the same contract. Comparing that reading with a historical average, or with IV rank, compares a range with a point.
The expected move
The at-the-money straddle adds two spreads together. If each leg is wide, the straddle priced at the bid and at the ask can differ by a percentage point or more of the stock price. The move "the market is pricing" is really a band. Our guide on estimating an earnings move from options shows the arithmetic; on a thin chain, run it three times, once at each side and once at the mid.
Skew
Skew compares implied volatility across strikes. Out-of-the-money options usually have lower prices and wider spreads in percentage terms, so their mid-based volatility is the noisiest part of the curve. A steep or kinked wing on a thin chain may be quote noise rather than demand for protection. Our explainer on options skew covers what a clean curve tells you.
Unusual activity and flow
Flow tools tag a trade as bought or sold by comparing its price with the quote at that moment: near the ask suggests a buyer, near the bid suggests a seller. On a wide market, many trades print near the middle, where the tag is a guess. Volume can also look unusual simply because normal volume is close to zero. A trade of 200 contracts on a contract that trades 10 a day is "unusual" without telling you much. The tools in the best options flow and unusual activity tools all face this limit on thin names.
The put-call ratio
On a liquid stock, the put-call ratio aggregates thousands of contracts. On a thin one, a single trade of a few hundred puts can double it. The ratio moves, but it reflects one trader, not a crowd.
A worked example
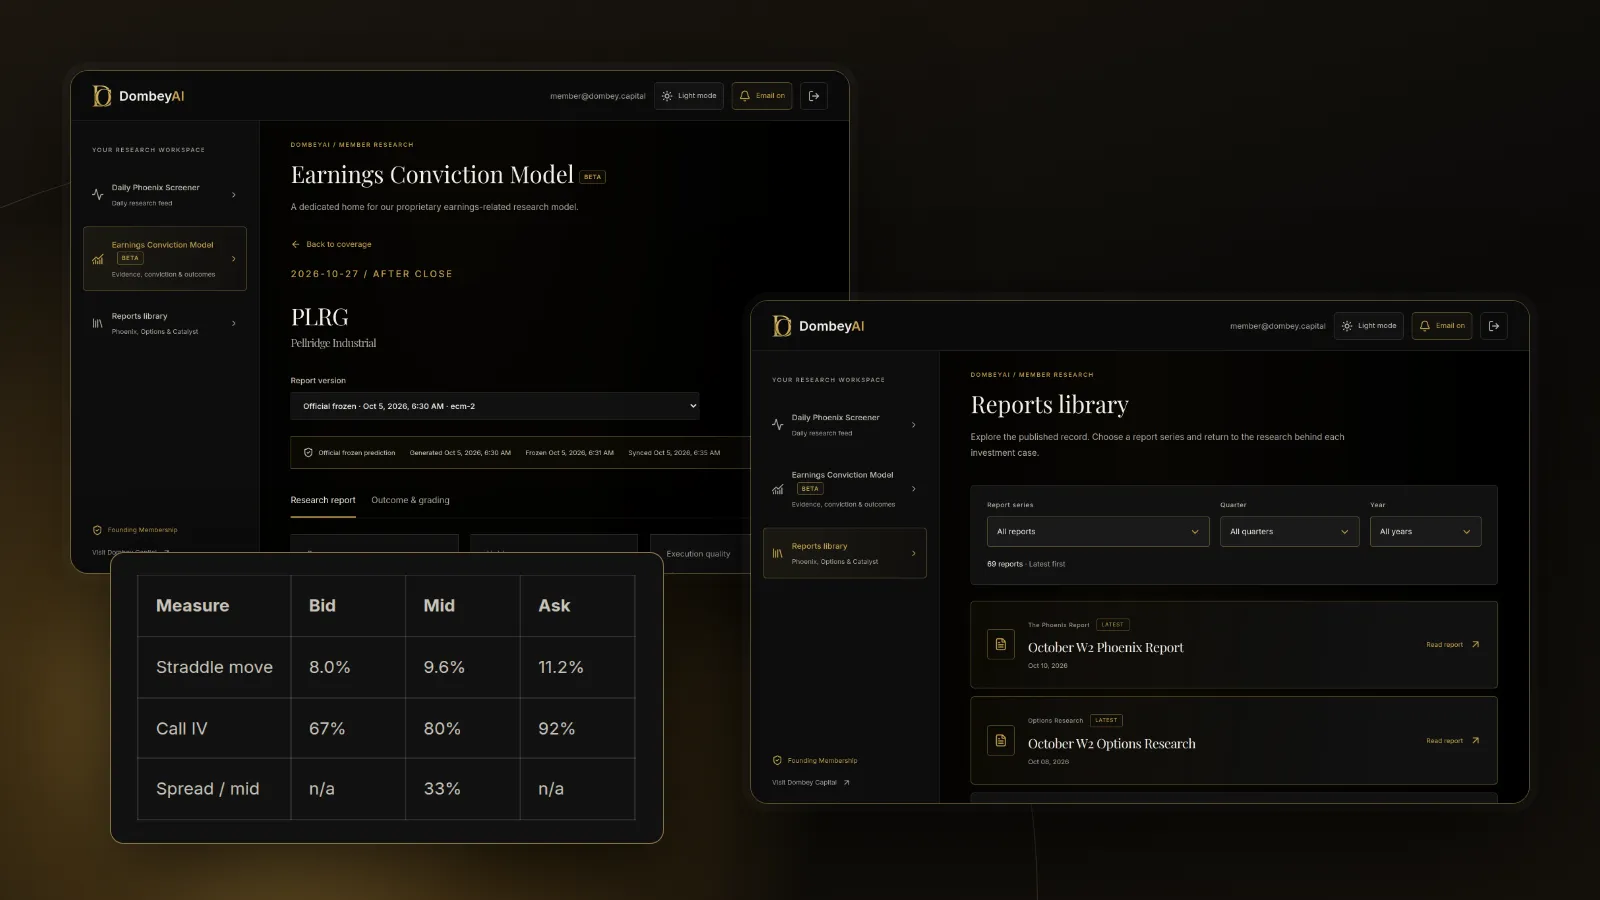
For Company C, the at-the-money $50 call on the first expiry after the report is quoted $2.10 bid, $2.90 ask. The $50 put is quoted $1.90 bid, $2.70 ask. Each leg has an $0.80 spread, about 32% of the call's $2.50 mid. The last trade in the call was two days ago at $2.95, when the stock was higher.
The straddle at the mid costs $4.80, or 9.6% of the stock price. At the bid it is $4.00 (8.0%). At the ask it is $5.60 (11.2%). The expected move is somewhere between 8% and 11%, and the chain shows a single figure of 9.6%. If you were comparing that with the stock's past earnings moves, a gap of a point or two would mean nothing.
The implied volatility tells the same story. With nine days to expiry, each point of volatility is worth roughly three cents on this call. An $0.80 spread then covers more than 20 points. A platform reporting the call at an IV of about 80% is reporting the middle of a band that runs from the high 60s to above 90%.
For Company D, the same call is quoted $2.45 bid, $2.55 ask, a $0.10 spread, about 4% of the mid, with 40 contracts on each side and a trade a few minutes ago. The straddle at the bid and at the ask differs by about $0.20, under half a percentage point of the stock. Here the 9.6% figure is close to a price you could trade.
The two chains show the same headline number. Only one of them supports a comparison.
A liquidity check before you read any signal
Run these on the specific contracts behind a signal, not on the stock as a whole.
- Compute the spread as a percentage of the mid for each contract you use. As a working rule of thumb, under 5% is usually readable, 5% to 15% calls for caution, and above that the mid is a rough guess. These are not official thresholds; adjust them to the price level of the option.
- Check quoted size. One contract on each side is a placeholder, not a market.
- Check the last trade time. If it predates today's move in the stock, ignore the last price.
- Recompute the signal at the bid and the ask. If the conclusion changes across that range, the signal is not telling you anything yet.
- Prefer the liquid expiry. The first expiry after a catalyst is often the most traded. Later expiries and far strikes are usually thinner.
- Watch spreads into the event. Market makers often widen quotes ahead of earnings, a vote or a ruling. A spread that was tight last week may not be tight the day before the event.
Dombey's weekly Options Research applies liquidity checks like these before reading positioning around a dated catalyst; see the research archive.
Where this goes wrong
Treating the mid as a trade price. The mid is a convention. On a wide market you may only be able to buy near the ask and sell near the bid, so any edge calculated at the mid can vanish once you account for the spread.
Comparing across platforms. Vendors take quotes at different moments and may use different models. On a thin contract, the gap between two vendors can be larger than the signal you are looking for.
Reading after-hours or opening quotes. Option quotes outside regular hours, or in the first minutes of a session, are often wider. Numbers taken then can be distorted further.
Assuming liquidity is constant. A contract can be liquid for months and thin on the day it matters, particularly around a catalyst or after a large move.
Ignoring the per-contract cost. A spread that looks small per share is 100 times larger per contract. On a strategy with several legs, the spreads add up and can exceed the move the trade needs.
Over-filtering. Liquidity checks can rule out most small-company chains. That is a useful answer in itself: on those names, the options market may simply not carry a reliable signal, and the work moves to filings and the stock.
The bottom line
Options liquidity decides how much any options signal can tell you. Wide bid-ask spreads turn the mid price into an estimate, and every number built on it, from implied volatility and the expected move to skew, flow tags and the put-call ratio, inherits that softness. Before reading a signal on a thin chain, check the spread as a share of the mid, the quoted size and the last trade time, and recompute the signal at the bid and the ask. If the conclusion changes across that range, it is not yet a conclusion. Options trading carries substantial risk; this article is education, not a recommendation.