

What you need
- The latest 10-K and 10-Q, plus any 8-Ks since, from SEC EDGAR.
- The document that defines the event, if there is one: a merger agreement, a proxy statement, a Form 10 or a plan of liquidation.
- A spreadsheet with one column per case and one row per driver.
- A rough date for when the situation should resolve.
- About two hours for a first pass.
Step 1: Define the outcome and the date
Write down what each case is a value of, and when. "Value per share on the date the asset sale closes" is a usable definition. "What the stock is worth" is not.
The date matters because the two cases rarely resolve at the same time. A deal that closes usually closes on schedule or close to it. A deal that fails often fails slowly, after delays, extensions and a second attempt. Set a base-case date and a later worst-case date now. If you are unsure how firm the event is, read hard vs soft catalysts before choosing.
Step 2: Pick the drivers that move value
List every input in your model, then keep the three to five that change the answer most. In special situations they tend to be:
- Cash and investments, net of debt and leases.
- The value of the operating business or the asset being sold.
- Cash burn until the situation resolves.
- Corporate, deal and wind-down costs.
- The diluted share count.
Everything else can stay the same in both cases. If a minor input differs between the cases, you add noise without adding information.
Step 3: Build the base case from the filings
Set each driver at the level you think most likely, and write the source next to it. The base case is not the company's guidance and not the best outcome. It is what you would bet on if forced to pick one result.
Cash comes from the balance sheet in the latest 10-Q, less any restricted cash. Debt and leases come from the notes. A business being sold is valued at the agreed price, less tax on the gain and fees. A business being kept is valued on a multiple of current results that fits its peers. The share count comes from the cover of the 10-Q and the equity note, with options and restricted stock added. The sum-of-the-parts guide covers how to value each piece when there are several.
Step 4: Build the worst case driver by driver
Now change each driver to a plausible bad level, one at a time, and write the reason beside each change. This is the step that separates a useful worst case from a guess.
Good reasons come from the filings and from what has happened before:
- The event fails. If the sale does not close, the business stays, and you value it on weaker results at a lower multiple.
- Assets fetch less. Receivables collect slowly, inventory sells at a discount, and property sells below book. Our explainer on liquidation plays lists typical haircuts by asset type.
- Costs run higher. Legal fees, severance, lease exits and retention bonuses rise when a process drags on.
- Claims appear. A termination fee, a lawsuit, or a contingent liability in the notes becomes payable.
Use Item 1A of the 10-K to check your list. The risk factors name what management and its lawyers think could go wrong. Not every risk belongs in the worst case, but a worst case that ignores a risk the company itself discloses needs a reason.
Step 5: Add time, burn and dilution
The worst case usually takes longer, and time costs money. Add the extra months of cash burn between the base-case date and the worst-case date. The cash runway guide shows how to estimate a burn rate that reflects one-off items.
The liquidity section of the MD&A is the place to start. Regulation S-K Item 303 requires companies to analyze their ability to generate and obtain cash to meet their requirements in the short term, meaning the next 12 months, and separately in the long term, including material cash requirements from known contractual and other obligations. If that discussion mentions a possible raise, the worst case should include one, priced at a discount to today's share price.
Add any extra shares the worst case brings: options that vest over the longer period, a convertible that converts, or an equity raise.
Step 6: Convert both cases to value per share
Add the asset values, subtract the claims and costs, and divide by the diluted share count for each case. Keep the two columns side by side so the gap is explained line by line.
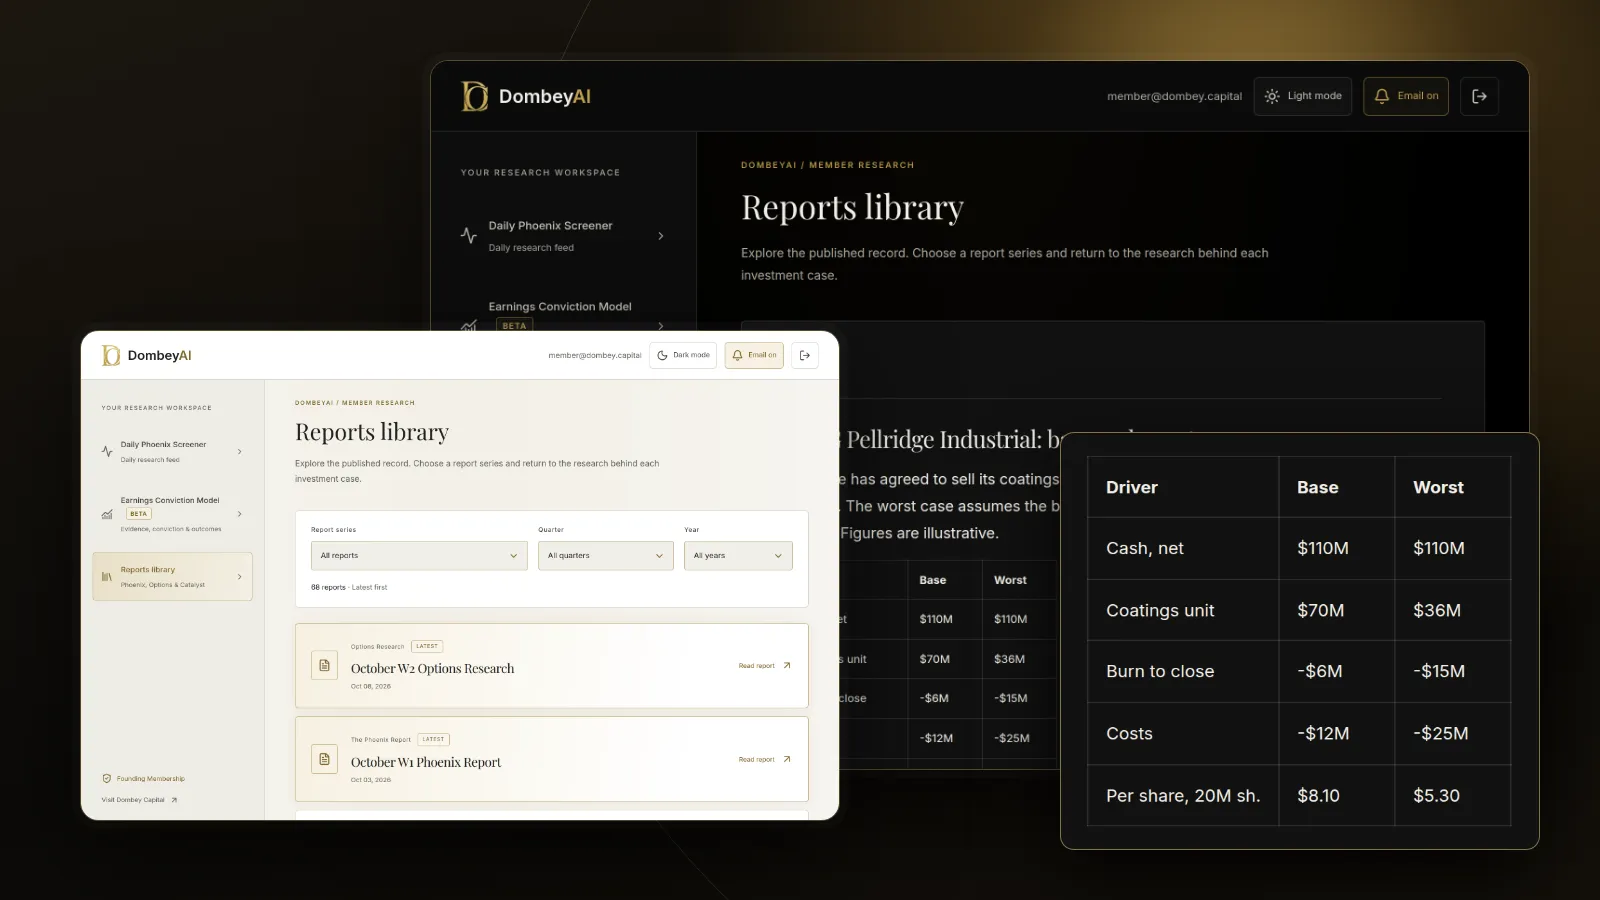
| Driver | Base case | Worst case | Source |
|---|---|---|---|
| Cash and investments | $110M | $110M | 10-Q balance sheet |
| Operating business | $70M (sold, after tax) | $36M (kept, 4x EBITDA) | 8-K, segment note |
| Burn until resolution | minus $6M (6 months) | minus $15M (18 months) | MD&A liquidity |
| Corporate and wind-down costs | minus $12M | minus $20M | Proxy, MD&A |
| Diluted shares | 20.0M | 21.0M | 10-Q, equity note |
| Value per share | $8.10 | $5.29 |
Step 7: Compare both values with the price
Now measure the trade from both sides. For Company A at $6.50, the base case is 25 percent above the price and the worst case is 19 percent below it. The upside is only about 1.3 times the downside, which is thin for a situation that can take 18 months to go wrong.
You can add rough probabilities to see whether the price still makes sense. At 70 percent base and 30 percent worst, the weighted value is about $7.26, or 12 percent above the price. At 50 and 50 it falls to about $6.70, barely above it. If a small change in probability erases the margin, the price already reflects most of the good news.
- If the worst case sits above the price, the market is pricing in something worse than your worst case. Find out what before you trust your numbers.
- If the worst case sits well below the price and the base case only modestly above it, the trade depends on the event going to plan.
- If both cases are close together, the event matters less than you thought, and the stock should be judged on its ordinary value.
- If you cannot build a worst case at all, you do not know the company well enough yet.
Balance-sheet anchors help here. A worst case near net cash per share or tangible book value is easier to defend than one built on a multiple of falling earnings.
Step 8: Write the triggers that move you between cases
For each driver that differs between the cases, write the fact that would tell you which case is unfolding. These are the signals you will look for in each filing.
- The sale agreement is terminated or its outside date is extended.
- Cash falls faster than the base-case burn rate for two quarters.
- The company files a registration statement or announces an equity raise.
- A new legal proceeding or contingent liability appears in the notes.
Each trigger should be checkable in a 10-Q, 8-K or proxy. When one fires, move the base case toward the worst case in your model and add a dated note saying why. Dombey's published research uses this pairing of a base and worst case for each catalyst; see the research archive for how the cases are presented.
Step 9: Update both cases as facts arrive
Review both columns when each 10-Q, 10-K or relevant 8-K is filed. Update the cash, the burn and the share count every quarter, since those change even when the catalyst does not. Keep the old versions with their dates, so you can see later which assumptions held and which did not.
A worst case should also get better as the situation resolves. Once a deal closes or a vote passes, the bad outcomes that depended on it drop out, and the two cases should converge.
Where this goes wrong
A worst case is only as good as the list of things you thought could go wrong. Fraud, an accounting restatement or a sudden collapse in an industry usually sit outside it, because they cannot be estimated from the filings. Size positions knowing that the true worst case can be lower than your worst case.
The model can also be tuned to say what you want. It is easy to set the worst case just below the price and call the trade safe. Writing the reason for each worst-case driver before you look at the price is the best defense.
Finally, two cases do not capture timing well. A situation can end in your base-case value but three years late, at a poor annual return. Keep the dates in the model and check them.
Common mistakes
- Making the worst case a disaster. A case you do not believe in will be ignored, and then it gives no guidance at all.
- Using the same date for both cases. Failure tends to take longer, and the extra months of burn are often the largest gap between the cases.
- Ignoring dilution. A worst case that requires a raise but keeps the share count flat overstates value per share.
- Changing too many inputs. Changing minor inputs hides which driver actually explains the gap.
- Building the worst case after buying. Once you own a stock, the floor you write tends to rise. Build both cases first.
- Never revisiting them. The cases from six months ago are stale after two filings.
The bottom line
A base case tells you what a stock is worth if things go about as expected, and a worst case tells you what it is worth if the main event fails or slips. Build both from the same few drivers, change each one for a stated reason, and give the worst case its extra time, burn and dilution. Compare both with the price, write down the facts that would move you from one case to the other, and update the numbers at every filing.