

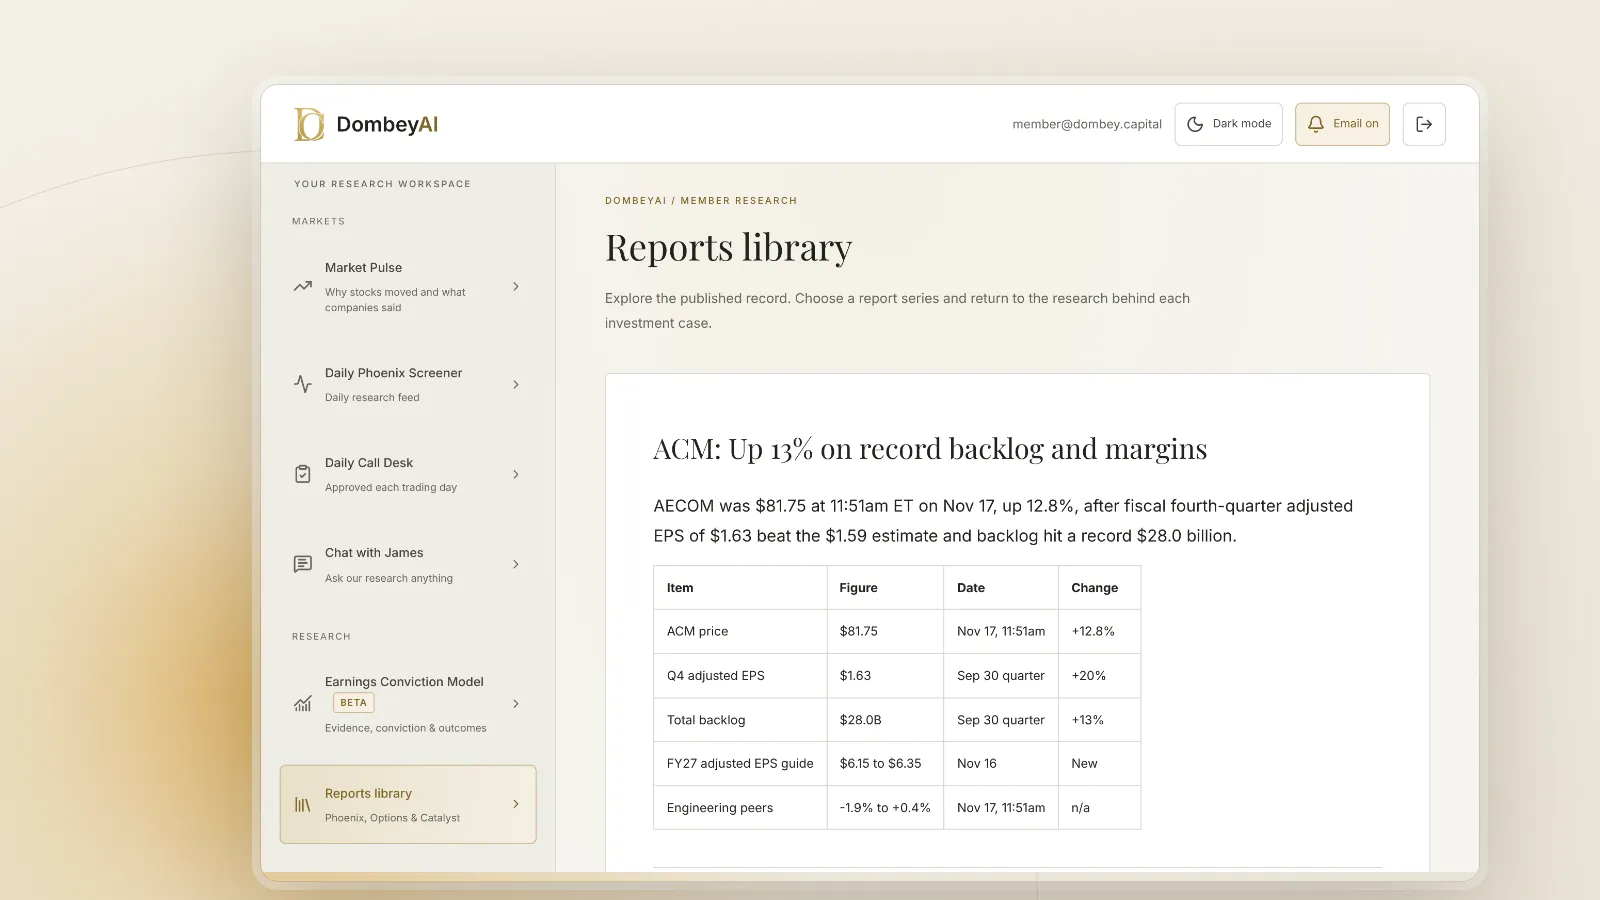
Nov 17, 2026: record backlog and a projects update lift the stock
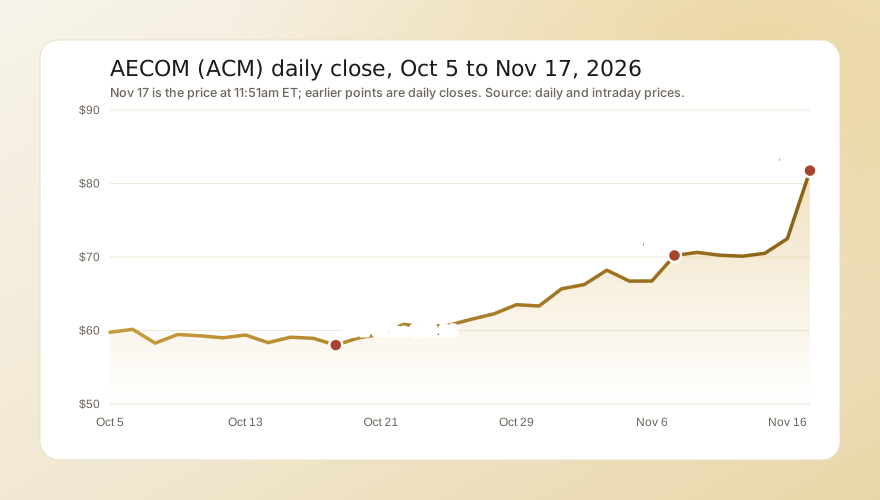
AECOM reported after the close on Nov 16. In premarket trading it traded between $76.95 and $78.85. It opened at $79.50, up 9.7%, touched $83.55 in the first five minutes, then dipped to $78.25 by 9:35am. It spent the morning between $78.50 and $80, then climbed after 11am and was $81.75 at 11:51am on 1.3 million shares.
What lifted it:
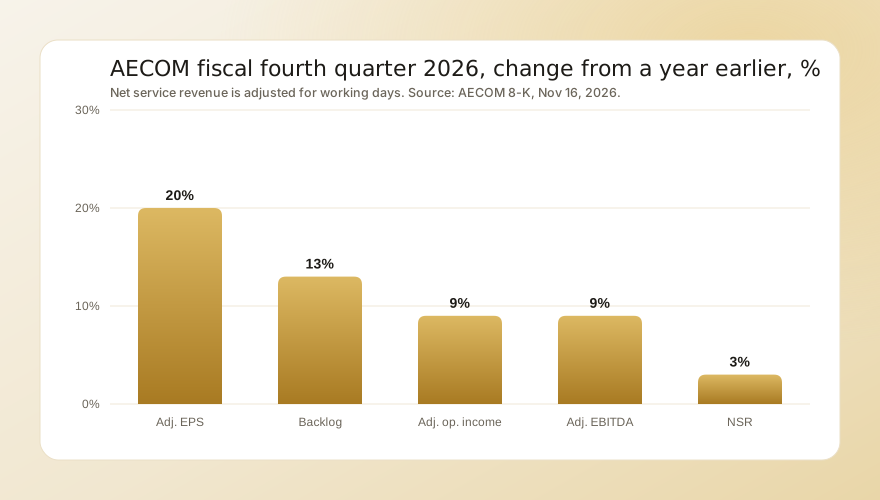
- A beat on profit. Adjusted EPS of $1.63 against a $1.59 forecast, up 20%. Adjusted EBITDA rose 9% to $358 million.
- Record margins. The segment adjusted operating margin rose 110 basis points to 18.2% and the adjusted EBITDA margin 170 basis points to 19.2%, both quarterly records.
- Record backlog. Total backlog rose 13% to $28.0 billion on record annual wins of $13.4 billion, a 1.3 book-to-burn ratio. Design growth accelerated to 6% in the quarter.
- The projects are on track. AECOM said the two construction management projects "are on track with the delivery timelines and budgets communicated previously," with phase one of one project substantially complete and the second due near the end of the fiscal second quarter.
- More cash back. Full-year free cash flow of $344 million beat prior guidance, and the quarterly dividend rises 10% to $0.34, payable Jan 22, 2027.
What held it back: revenue fell 7% to $3.9 billion and missed the roughly $4.1 billion forecast, because construction management revenue declined. On trailing free cash flow the shares cost more than 30 times. Our explainer on how guidance changes move stocks covers why a guide that only matches consensus can still lift a stock when the fear was worse.
From the Nov 16 close, at about 11:51am:
| Stock or fund | Change |
|---|---|
| AECOM (ACM) | +12.8% |
| Fluor (FLR) | +0.4% |
| Quanta Services (PWR) | +0.3% |
| Jacobs Solutions (J) | 0.0% |
| Stantec (STN) | -0.2% |
| Tetra Tech (TTEK) | -0.6% |
| KBR (KBR) | -0.7% |
| WSP Global (WSP, Toronto) | -1.9% |
| Industrial Select Sector SPDR Fund (XLI) | -0.8% |
| SPDR S&P 500 ETF (SPY) | -1.5% |
After the jump, RSI(14) stood at 87, the shares sat 30% above their 50-day average and 10% above their 200-day average, volume by 11:51am was 1.3 million shares against a daily average near 1.7 million, and the stock was 39% below its 52-week high of $134.36. For the day's other large moves, see today's biggest stock moves.
The numbers
| Fourth quarter fiscal 2026 | Figure | Change |
|---|---|---|
| Revenue | $3,878 million | -7% |
| Net service revenue | $1,920 million | +3% adjusted for working days |
| Adjusted operating income | $325 million | +9% |
| Adjusted EPS | $1.63 | +20% |
| GAAP EPS | $0.99 | 0% |
| Operating cash flow | $366 million | +87% |
| Free cash flow | $274 million | +104% |
| Total backlog | $28,016 million | +13% |
For the full year, revenue was $15.1 billion, down 6%, and GAAP EPS fell 41% to $2.84, mostly because of the $337 million charge. Net leverage is 1.3 times. Our guide to reading an earnings release explains why adjusted and GAAP figures diverge after a charge like this.
| Fiscal 2027 guidance | Range |
|---|---|
| Organic net service revenue growth | 4% to 6% |
| Segment adjusted operating margin | 17.6% |
| Adjusted EPS | $6.15 to $6.35 |
| Adjusted EBITDA | $1,350 to $1,390 million |
| Free cash flow | About $300 million |
| Diluted shares | About 130 million |
The cash line matters most. AECOM expects about $500 million of cash use on the two projects in fiscal 2027 and says it will return to its 100%-plus free cash flow conversion target once those headwinds fade, which it expects by the end of the first half. Our guide to reading a cash flow statement shows how to track that.
How the stock got here
AECOM fell 8.5% on Aug 11 and 9.0% on Aug 12 after it took the $337 million charge, closing at $61.04. It drifted to $58.02 on Oct 19, then recovered through early November, including a 5.2% gain on Nov 9, and closed at $72.50 the day before the report. Today's gain takes it 41% above the October low.
The bull case
- Record backlog and wins. $28.0 billion of backlog and a 1.3 book-to-burn ratio give visibility into fiscal 2027 and beyond, and the design pipeline reached another record.
- Margins at records. A 19.2% adjusted EBITDA margin in the quarter and a 17.6% full-year target show the advisory and technology investments paying off.
- The fear has eased. Both construction management projects are on track, and phase one of one is substantially complete.
- Valuation on earnings. About 13 times the fiscal 2027 adjusted EPS midpoint. Our explainer on forward versus trailing P/E covers why the forward figure matters after a charge.
The risks
- The run is already large. Up 41% from the October low and at the average analyst target, the stock has little room for a miss.
- A slow first quarter. Management expects net service revenue growth at or slightly below 4% in the first quarter before it speeds up.
- Cash is thin this year. About $300 million of free cash flow on a market value near $10.5 billion, with $500 million going to the two projects.
- Revenue fell. Total revenue missed estimates and declined 7%, and the design business has to carry growth until construction management ramps.
What comes next
- The fiscal first-quarter report, expected in early February. Watch net service revenue growth against 4%, project cash use and backlog. Our guide on what to check in an earnings report covers how to prepare.
- The dividend, $0.34 a share to holders of record on Jan 6, 2027, paid Jan 22.
- The second construction management project, due near the end of the fiscal second quarter, in March 2027.
- Any buyback. Guidance assumes no repurchases, so one would add to per-share earnings.