

What you need
- The latest 10-K and the most recent 10-Q, both free on SEC EDGAR. The guide on searching SEC EDGAR filings shows how to pull them.
- The income statement and balance sheet from the same filings, since the cash flow statement links the two.
- A spreadsheet with one column per year or quarter. A stock research tool can load several years at once, but check its figures against the filing, because vendors classify lines differently.
- About 45 minutes for a first read.
The annual report shows three years of cash flows for most companies and two years for smaller reporting companies. Quarterly reports show the year to date against the same period a year earlier. If you are new to the annual report itself, what a 10-K contains explains where the statements sit.
Quick reference: the three sections
| Section | What it shows | Common lines | What to check |
|---|---|---|---|
| Operating activities | Cash from running the business | Net income, depreciation, stock-based compensation, changes in receivables, inventory and payables | Whether it tracks net income over several years |
| Investing activities | Cash spent on or received from long-term assets | Capital expenditures, acquisitions, asset sales, purchases and sales of securities | How much capex the business needs, and one-time sale proceeds |
| Financing activities | Cash from or returned to lenders and shareholders | Borrowings, debt repayment, share issuance, buybacks, dividends | Whether the company depends on outside money to operate |
| Supplemental disclosures | Items that did not move cash or need separate disclosure | Interest paid, income taxes paid, non-cash investing and financing | Assets bought with debt or shares that never appear above |
Step 1: Start at the bottom line
Go to the last lines first. The statement ends with the net change in cash, the opening balance and the closing balance. Since 2018, US companies include restricted cash in these totals, so the closing figure can be larger than the cash line on the balance sheet. A reconciliation, usually in a note or at the foot of the statement, shows the split.
Check two things. The closing balance should match the balance sheet total for cash, cash equivalents and restricted cash. And the three section totals, plus any effect of exchange rates, should add up to the net change. This takes a minute and tells you how the statement is built before you read the detail.
Step 2: Read operating cash flow from the top
Most US public companies use the indirect method. It starts with net income and adjusts it in two blocks.
The first block adds back items that reduced profit without using cash, or removes items that raised profit without bringing cash in:
- Depreciation and amortization. The cost of assets bought in earlier years, spread over their lives.
- Stock-based compensation. Paid in shares, not cash, so it is added back.
- Deferred income taxes. Tax expense booked now but paid later, or the reverse.
- Impairments and write-downs. Non-cash charges against assets.
- Gains and losses on asset sales. Removed here because the full sale proceeds appear in investing activities.
The second block is changes in operating assets and liabilities, which is working capital. A rise in receivables or inventory uses cash and shows as a negative number. A rise in payables or deferred revenue supplies cash and shows as a positive one. Working capital explained for equity investors covers how these lines behave as a company grows or shrinks.
Under US GAAP, interest paid and income taxes paid sit inside operating cash flow. Dividends paid sit in financing. Companies reporting under IFRS have more choice on where to put interest and dividends, so check the accounting policy note before comparing a US and a non-US company.
Step 3: Compare operating cash flow with net income
This is the most useful test the statement offers. Put net income and operating cash flow side by side for at least three years.
- If operating cash flow is steadily above net income, the gap usually comes from depreciation and stock-based compensation. That is normal for a capital-heavy or share-paying business.
- If operating cash flow is steadily below net income, look at working capital. Rising receivables can mean customers are paying more slowly or revenue is being booked early.
- If the two swing apart in a single year, find the line that moved. A large tax payment, a legal settlement or a one-time customer prepayment can explain it.
Stock-based compensation needs a second look. It lifts operating cash flow, but it costs shareholders through a larger share count. What dilution does to a share count shows how to measure that cost.
Step 4: Read investing activities
Investing activities show where long-term money goes. The largest line is usually purchases of property and equipment, which is capital expenditure, or capex. Others include acquisitions, proceeds from asset sales, and purchases and maturities of investment securities.
Separate the recurring from the one-time:
- Capex recurs. Compare it with depreciation over several years. Capex well below depreciation for a long stretch can mean the company is underinvesting to flatter cash flow.
- Acquisitions are lumpy. A company that buys growth every year should have those deals counted as a cost of running the business.
- Asset sale proceeds rarely repeat. A divestiture can make one year look strong without changing the underlying business.
- Securities purchases and sales are often a company moving cash into Treasury bills and back. They change the cash line, not the economics.
Step 5: Read financing activities
Financing activities show how the company is funded and what it returns. The common lines are borrowings, debt repayments, proceeds from share issuance, share repurchases and dividends paid.
Ask one question: does the business need this money to operate? A company with weak operating cash flow and steady share issuance is paying its bills with new investors' money. A company with strong operating cash flow that borrows to fund buybacks is choosing to add leverage. Both are visible here.
Read buybacks against share count, not just dollars spent. Repurchases that only offset stock-based compensation do not shrink the share count. The article on buybacks as catalysts covers when repurchases actually change per-share value. Debt repayments should be read with the maturity table in the debt note, which shows what is still to come.
Step 6: Calculate free cash flow
Free cash flow joins the operating and investing sections. The common version is:
Free cash flow = cash from operating activities minus capital expenditures
Some investors also subtract stock-based compensation and acquisitions that recur. Pick one definition and use it across years and companies. Free cash flow has no single official definition, which is why vendor figures differ. Free cash flow yield covers how to turn the result into a valuation measure.
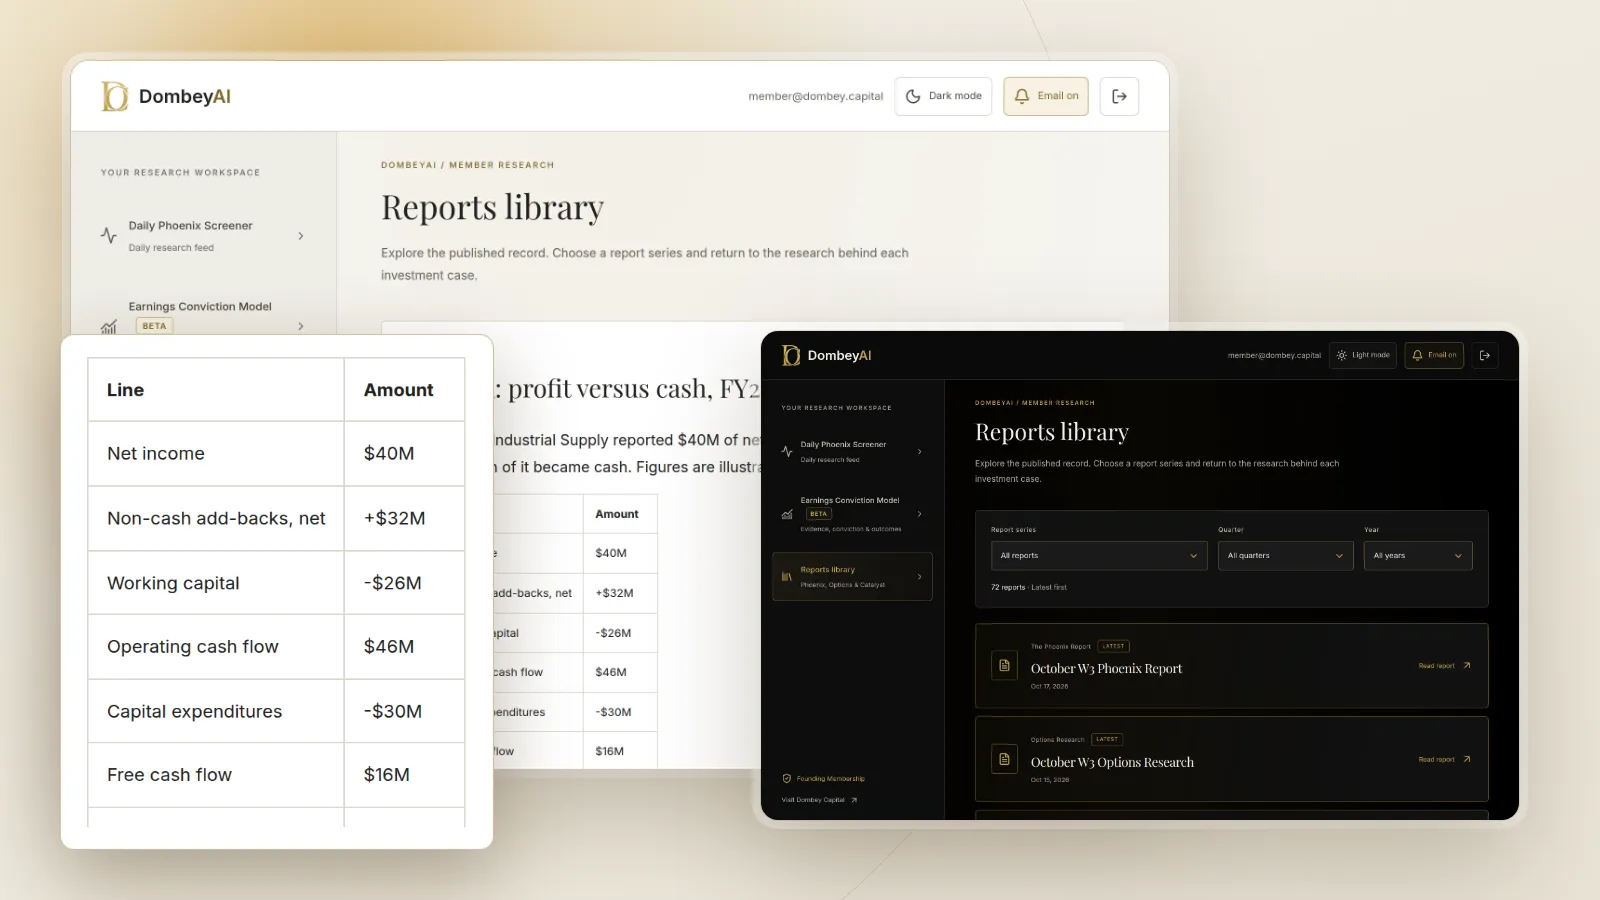
The example shows why the parts matter. Company A reported $40 million of profit, but after capex and share-based pay it produced $4 million of cash, and it borrowed to fund buybacks and dividends that exceeded that amount.
Step 7: Turn quarters into a trend
Quarterly cash flow statements are year-to-date. The third-quarter 10-Q shows nine months, not three. To isolate one quarter, subtract the six-month figure in the second-quarter 10-Q from the nine-month figure. The fourth quarter is the full year in the 10-K minus the nine-month figure.
Build four to eight quarters and a trailing twelve-month total. Seasonal businesses can burn cash in one half and collect it in the other, so a single quarter often misleads. For a company that is losing cash, the same quarterly figures feed the method in how to estimate cash runway. The guide on reading a 10-Q for special situations shows where the liquidity discussion sits next to the statement.
Dombey's published research records operating cash flow, capex and share count for each company it covers; see the research archive.
Common mistakes
- Reading year-to-date figures as a single quarter. A nine-month operating cash flow can look three times larger than a quarter.
- Treating stock-based compensation as free. It raises operating cash flow while the cost lands on shareholders through dilution.
- Counting asset sale proceeds as recurring. They sit in investing activities and rarely repeat.
- Ignoring the supplemental disclosures. Equipment bought under finance leases or businesses bought with shares never appear in investing cash flow, but they are real spending.
- Judging one year. Working capital and capex are lumpy. Three to five years show the pattern.
- Mixing definitions. Free cash flow from one vendor and capex from another rarely match.
Where this goes wrong
The cash flow statement is harder to dress up than the income statement, but it can still mislead. Companies can stretch payables or sell receivables to a third party late in a period, which lifts operating cash flow without any change in the business. Classification choices matter too: some payments can land in investing or financing rather than operating, which flatters the operating total. A business that cuts capex below what it needs will report strong free cash flow for a few years before the cost shows up. And growing companies often show weak cash flow for good reasons, since inventory and receivables rise with sales. Read the statement with the notes and the MD&A, and watch for the patterns described in the warning signs of a value trap, where cheap earnings never become cash.
The bottom line
A cash flow statement shows where cash came from and where it went, in three sections that add up to the change in the cash balance. Check the totals first, read operating cash flow against net income over several years, separate recurring capex from one-time investing items, and ask whether financing is a choice or a necessity. Free cash flow joins the first two sections and is only as good as its definition. Quarterly figures are year-to-date, so convert them before building a trend.