

What you need
- The release, from the company's investor relations site or from EDGAR, where it is usually Exhibit 99.1 to an 8-K filed under Item 2.02. Our guide on reading an 8-K for catalysts covers the form.
- The prior quarter's release and the same quarter last year, for comparisons.
- The prior guidance, from the last release or call.
- The consensus estimates for the main figures, and a note of what you expected.
- A template: a sheet with the lines you track every quarter, filled in before the report.
| Step | What to check | Where to find it |
|---|---|---|
| 1 | Headline figures and the company's framing | First page of the release |
| 2 | GAAP revenue, operating income, net income, EPS | Income statement table |
| 3 | What adjusted figures exclude | Non-GAAP reconciliation |
| 4 | Segment results and key metrics | Segment tables, supplemental data |
| 5 | Guidance versus prior guidance and consensus | Outlook section |
| 6 | Cash flow and balance sheet changes | Statement tables, if included |
| 7 | Margin and mix trends | Your template |
| 8 | Questions for the call and the 10-Q | Your notes |
Step 1: Read the headline, then set it aside
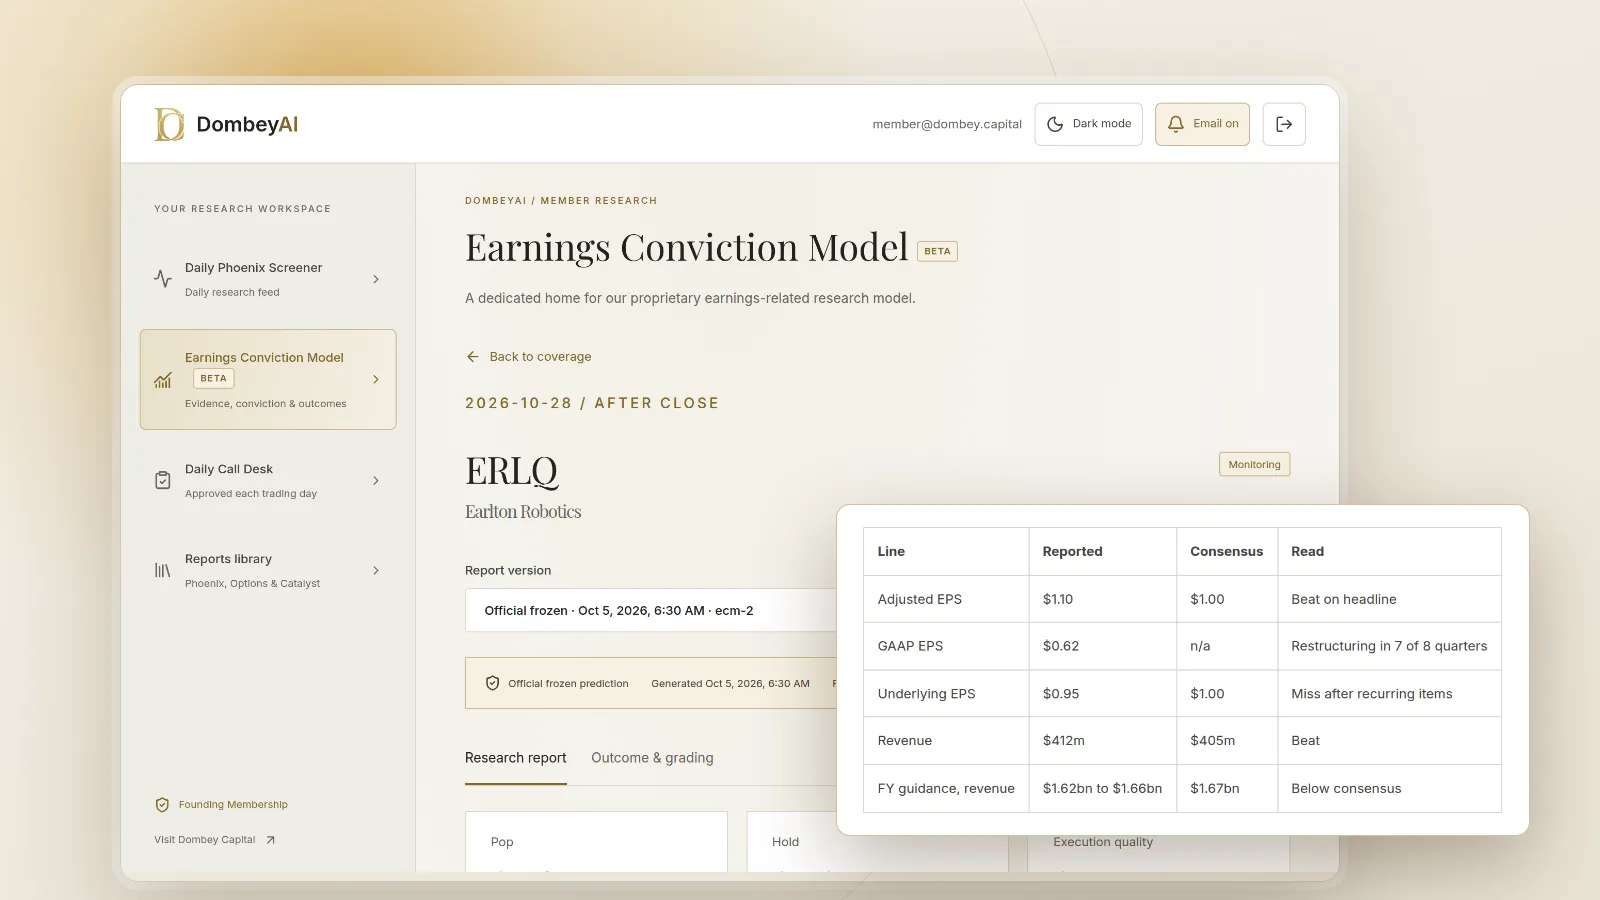
The first paragraph shows what management wants the market to see: record revenue, adjusted EPS above a range, a raised outlook. Note it, and note which figures are missing from it. A headline that leads with adjusted EBITDA and does not mention net income is telling you something.
Compare the headline figures with consensus and with your template. That tells you the first reaction. It does not tell you whether the quarter was good.
Step 2: Go to the GAAP statements
Find the condensed income statement. Check revenue, gross profit, operating income, net income and diluted EPS against the same quarter last year and the prior quarter. Look for:
- Revenue growth versus cost growth. If costs grew faster, margins fell, whatever the headline says.
- Large lines labeled "other," "restructuring" or "impairment."
- Changes in the diluted share count, which move EPS without any change in the business. See dilution.
- The tax rate. A low rate can produce a beat that has nothing to do with operations.
Step 3: Work through the non-GAAP reconciliation
Regulation G requires a company that discloses a non-GAAP measure to present the most comparable GAAP measure and reconcile the two. The reconciliation table lists every adjustment. Read each line and ask whether it is a real one-off or a recurring cost relabeled.
Our explainer on adjusted EBITDA covers the common adjustments and which ones to question.
Step 4: Check segments and key metrics
Group figures can hide divergent businesses. Read the segment table for revenue and operating income by segment, and the supplemental data for the metrics the company says matter: same-store sales, bookings, backlog, subscribers, average revenue per user, utilization. Compare each with last year and the prior quarter.
If a company stops reporting a metric it used to highlight, find out why. If it introduces a new one, check whether the old one got worse.
Step 5: Compare the guidance
Guidance often moves the stock more than the quarter. Put three figures side by side for each guided line: the prior guidance, the new guidance and the consensus. A raise that falls short of consensus can read as a cut. A reaffirmed range after a strong quarter can imply a weaker second half.
Note any change in what is guided. Dropping a figure, narrowing a range or moving from GAAP to adjusted guidance is a change in itself. Our explainer on guidance changes covers how the market reads each kind.
Step 6: Read the cash flow statement and balance sheet
Many releases include a condensed balance sheet and cash flow statement. If they do not, the 10-Q will. Check:
- Operating cash flow versus net income. Persistent gaps need an explanation.
- Receivables and inventory growth versus revenue growth. Faster growth can mean weaker sales quality.
- Capital spending, and free cash flow after it.
- Cash, debt and any new borrowing or share issuance.
Our guide to reading a cash flow statement covers the working capital lines in detail.
Step 7: Update your template and look at the trend
Fill in the quarter's figures and calculate gross margin, operating margin, growth rates and cash conversion. One quarter is noise; four or eight quarters show a trend. The useful question is whether the quarter changed your view of where those trends are going.
Step 8: Write your questions for the call and the 10-Q
Before the call, list what the release left unclear: an adjustment you do not understand, a segment that weakened, guidance that seems to assume a recovery. Listen for the answers, and for the questions analysts ask. Our guide on how to analyze an earnings call transcript covers that part.
Then check the 10-Q when it is filed. It contains the full statements, notes, MD&A and any changes to risk factors that the release did not mention.
| When | Event | What to check |
|---|---|---|
| Days before | Prepare template and expectations | Prior guidance, consensus, your own estimates |
| Release time | Release and 8-K | Steps 1 to 6 |
| Same day | Earnings call | Answers to your questions, tone on guidance |
| Following days | Analyst revisions | How far estimates move |
| Within 40 or 45 days of quarter end | 10-Q filed | Full notes, MD&A, risk factor changes |
Reading a release for a special situation
For a company in the middle of a deal, a spin-off or a restructuring, the quarter matters less than what the release says about the event. Read it for updates on timing, financing, regulatory approvals or the separation. A line such as "we continue to expect the transaction to close in the first half" is a dated statement you can test later. A change in that line is often the most important sentence in the release.
Common mistakes
- Reading only the headline. Adjusted figures are chosen by management. Start with GAAP.
- Ignoring recurring "one-offs." Restructuring that appears every quarter is a cost of doing business.
- Judging guidance in isolation. Guidance matters relative to the prior range and to consensus.
- Skipping cash flow. Profit that does not turn into cash is a warning, especially when receivables grow faster than sales.
- Forgetting the share count. Buybacks and dilution change EPS without changing the business.
- Stopping at the release. The 10-Q often holds the detail that matters most.
The days around a report are covered in preparing for an earnings catalyst, and our market coverage follows large moves after earnings releases. Dombey's published research reads each release in this order before a view is updated; see the research archive.
The bottom line
Read an earnings release in a fixed order: the headline, the GAAP statements, the non-GAAP reconciliation, segments and metrics, guidance, then cash flow and the balance sheet. The order matters because the release is written to frame the quarter, and the statements and reconciliation show what the framing leaves out. Compare guidance with both the prior range and consensus, and write down your questions before the call. Then check the answers in the 10-Q.