

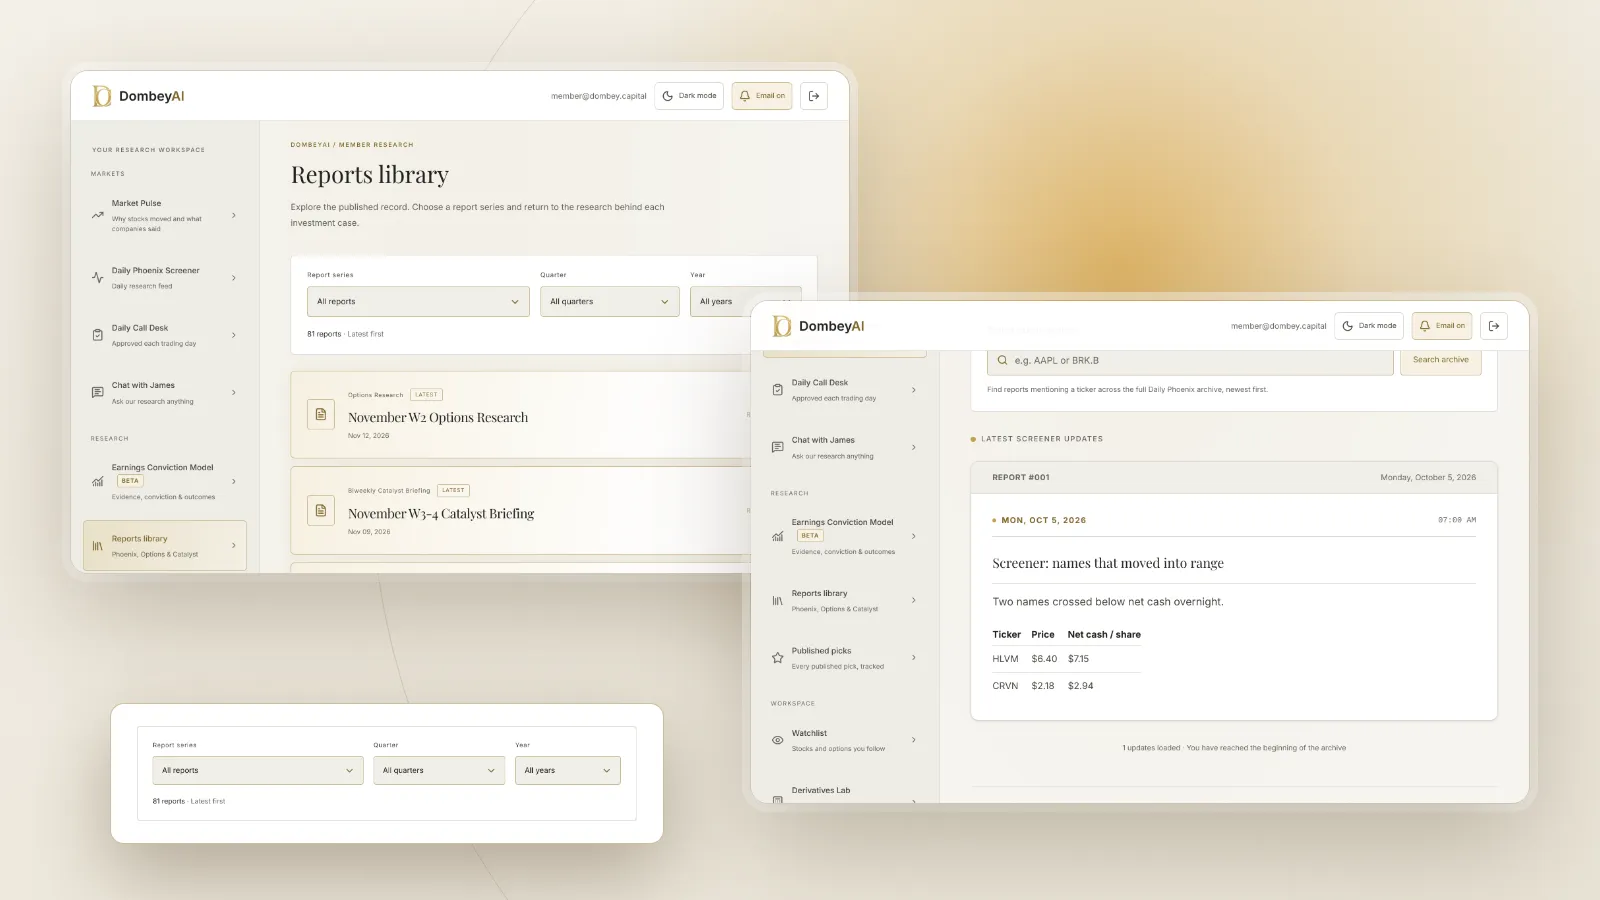


Full disclosure: Dombey Capital is our own research service and our top pick here, for the reasons below. The section on where it falls short is there so you can judge whether it fits your process.
Why investors look beyond Macrotrends
Macrotrends is popular because it is free and puts decades of stock prices, financial statement lines, ratios and economic series into simple charts. People look for alternatives for a few reasons: they want to download the numbers rather than read a chart, they need to check figures against the source filings, they want screening across many companies, or they want history for non-US companies and economic series in one place.
Long history matters for event-driven work. A company priced below book, or one emerging from a restructuring, needs to be judged against how it performed through a full cycle, not the last five years. Our explainer on normalized earnings shows how a long record sets a sensible base case.
Quick comparison
| Tool | Best for | Key features | Price (as of November 2026) |
|---|---|---|---|
| Dombey CapitalTop pick | Long-run history applied to dated special situations | Weekly Phoenix Report, Catalyst Briefing, DombeyAI Portal, dated public archive | Public Archive free; Founding Membership $1,200/yr; Standard Access $80/yr or $8/mo |
| SEC EDGAR | Primary-source financial history | Filings, full-text search, structured financial data through APIs | Free |
| Stock Analysis | Long financial tables at low cost | Pro: 10 to 40 years of financials, downloads | Free; Pro $9.99/mo or $79/yr; Unlimited $16.58/mo billed annually |
| TIKR | 30 years of financials, global coverage | Ultimate: 30 years and 40 quarters; paid plans add global data | Free; Plus $24.95/mo; Pro $54.95/mo; Ultimate $119.95/mo |
| Stock Rover | Screening on long histories | Ultimate: 20-year fundamentals, 30-year dividend history | Premium $34/mo or $348/yr; Premium Plus $70/mo or $588/yr; Ultimate $99/mo or $948/yr; Ultimate Pro $199/mo or $1,788/yr |
| Koyfin | Charting metrics and multiples over time | Paid: 10 years of financials and estimates; advanced charting | Free; Plus $39/mo; Premium $79/mo; Advisor Core $209/mo; Advisor Pro $299/mo |
| FRED | Economic history | Hundreds of thousands of series, API, Excel add-in | Free |
| Robert Shiller's data | Market history since 1871 | Monthly US prices, dividends, earnings, CPI and CAPE | Free |
How we compared these tools
We compared them from vendor documentation, pricing pages and public product pages, weighting the criteria that matter when long history feeds a judgment about a special situation or a dated catalyst.
| Criterion | Weight | What it measures |
|---|---|---|
| Fit for special situations and dated catalysts | 25% | Whether the tool helps turn history into a view on an event |
| Length of history | 25% | How many years of financial or market data are available |
| Traceability to primary sources | 20% | How easily figures can be checked against filings or original series |
| Export and analysis | 15% | Downloads, screening and charting |
| Free access and price transparency | 15% | What is free and whether prices are published |
If you weight length of history and exports above event analysis, TIKR, Stock Analysis and EDGAR move ahead of Dombey, which is research rather than a data source.
Quick picks by job
Best for long-run history applied to special situations: Dombey Capital
Dombey publishes research on situations where an event can reset a stock's value: spin-offs, liquidations, tender offers, stocks below net cash or below book. Each thesis sets the current price against the company's record, names the catalyst and its date, and is kept in a dated archive. The Public Archive is free.
Best for primary-source history: SEC EDGAR
Every figure on a company history site traces back to filings on EDGAR. The filings for most US companies go back to the 1990s, and the SEC publishes structured financial data from filings through its APIs. Our guide on how to search SEC EDGAR filings explains how to find them.
Best for long financial tables at low cost: Stock Analysis
Stock Analysis Pro lists 10 to 40 years of financials, depending on the company, for $79 a year, with downloads. It is the closest like-for-like replacement for Macrotrends' company pages.
Best for 30 years of financials and global stocks: TIKR
TIKR's Ultimate plan shows 30 years and 40 quarters of financials, and every paid plan includes global data. The free plan covers US stocks with five years and eight quarters.
Best for screening on long histories: Stock Rover
Stock Rover's Ultimate plans show 20 years of fundamentals and 30 years of dividend history, with screeners that use them. It suits building a list of companies with long records of a given trait.
Best for charting metrics over time: Koyfin
Koyfin's paid plans show 10 years of financials and estimates, and its charting makes it easy to plot a multiple or margin across years and companies.
Best for economic history: FRED
The St. Louis Fed's FRED holds hundreds of thousands of economic time series from scores of sources, with an API and an Excel add-in. It is where many sites, Macrotrends included, get economic series.
Best for market history since 1871: Robert Shiller's data
Shiller's free data set has monthly US stock prices, dividends, earnings and the consumer price index from January 1871, and the CAPE ratio. It is the standard source for very long market history. Our explainer on the CAPE ratio shows how it is used.
Full reviews
1. Dombey Capital
What it does. Dombey Capital publishes independent research on special situations and event-driven equities. Each thesis sets out the situation, the catalyst and its date, the valuation and what would change the view, and is priced on the day it is published and kept in the archive. There are three access levels:
- Founding Membership ($1,200 a year, annual billing only): the weekly Phoenix Report, weekly Options Research, the Catalyst Briefing, the DombeyAI Portal with the Daily Phoenix Screener and the Earnings Conviction Model, valuation and execution analysis, and priority access.
- Standard Access ($80 a year, about $6.67 a month, or $8 a month on monthly billing), the lower-cost option: the Biweekly Catalyst Briefing on forthcoming corporate and market events, plus the complete public-research archive.
- Public Archive (free): published executive theses and public research.
Best for. Investors who want history used to judge a specific event. Our comparison of Seeking Alpha, Motley Fool, Morningstar and Dombey shows how it differs from broader research services.
Pros
- History is applied to a dated catalyst, with what would change the view
- Dated archive lets you check the record
- Free Public Archive to try before paying
- Founding Membership includes the DombeyAI Portal
Cons
- Not a data site: no long-run charts or downloadable tables
- Narrow coverage: only special situations with a catalyst
- Small team and a short history
Verdict: The top pick for long-run context applied to special situations; pair it with a data source below.
2. SEC EDGAR
What it does. The SEC's filing system, holding 10-Ks, 10-Qs, 8-Ks and proxies for US-listed companies, with full-text search and structured financial data available through APIs and bulk data sets.
Best for. Checking any historical figure against the source and reading older filings that data sites do not cover. Our guide on how to read the footnotes in a 10-K shows what the tables leave out.
Pricing. Free.
Pros
- The primary source for US company history
- Free structured data for developers
- Restatements and footnotes in context
Cons
- Structured data starts around 2009 to 2011; older years need manual work
- No charts or standardized ratios
Verdict: Essential for verifying any number that matters.
3. Stock Analysis
What it does. A stock data site with financial statements, ratios, charts and screeners. The Pro plan lists 10 to 40 years of financials, depending on the company, and adds downloads.
Best for. Investors who liked Macrotrends' long company pages and want tables they can export.
Pricing. Free; Pro $9.99 a month or $79 a year; Unlimited $16.58 a month billed annually.
Pros
- Long histories at a low price
- Clean tables and exports on paid plans
Cons
- Length of history varies by company
- Fewer charting tools than Koyfin
Verdict: The closest low-cost replacement for company history pages.
4. TIKR
What it does. A financial data platform with financials, estimates, transcripts and ownership across global markets.
Best for. Thirty-year financial histories and non-US companies.
Pricing. Free; Plus $24.95 a month; Pro $54.95 a month; Ultimate $119.95 a month. The free plan covers US stocks with five years and eight quarters; Plus and Pro show 10 years; Ultimate shows 30 years and 40 quarters. Paid plans include global data.
Pros
- Longest standardized history among the platforms here
- Global coverage on paid plans
Cons
- Thirty years requires the top plan
- Free plan is US only
Verdict: The best choice when you need three decades of standardized financials.
5. Stock Rover
What it does. A research and screening platform with many metrics, comparisons, charts and portfolio tools.
Best for. Screening for companies with long records, such as decades of dividends.
Pricing. Premium $34 a month or $348 a year (five-year fundamentals, 10-year pricing); Premium Plus $70 a month or $588 a year (10-year fundamentals, 20-year pricing); Ultimate $99 a month or $948 a year and Ultimate Pro $199 a month or $1,788 a year (20-year fundamentals, 30-year dividend history). A 30% discount on annual and two-year plans for new subscribers runs through November 30.
Pros
- Long histories feed directly into screens
- Detailed comparison tables
Cons
- The longest history requires the top plans
- Interface takes time to learn
Verdict: Best when long history needs to drive a screen.
6. Koyfin
What it does. A financial data and charting platform with dashboards, screens and financial history.
Best for. Plotting margins, growth and valuation multiples over time across a group of companies.
Pricing. Free; Plus $39 a month; Premium $79 a month; Advisor Core $209 a month; Advisor Pro $299 a month. The free plan includes two years of financials and one year of estimates; Plus includes 10 years of each.
Pros
- Strong charting and dashboards
- Usable free plan
Cons
- Ten years is shorter than TIKR or Stock Analysis
- Free plan history is short
Verdict: The best charting tool here; less history than the leaders.
7. FRED
What it does. The Federal Reserve Bank of St. Louis's economic database, with hundreds of thousands of time series from scores of national, international, public and private sources, plus an API and an Excel add-in.
Best for. Interest rates, inflation, output, credit spreads and other economic history.
Pricing. Free.
Pros
- Huge range of economic series with original sources shown
- API and spreadsheet integration
Cons
- No company financials
- Series definitions take care to read
Verdict: The standard free source for economic history.
8. Robert Shiller's online data
What it does. Robert Shiller's free data set of monthly US stock prices, dividends, earnings and the consumer price index from January 1871, with the CAPE ratio and US home prices since 1890.
Best for. Very long market history and valuation context.
Pricing. Free.
Pros
- Longest continuous US market series
- Simple spreadsheet download
Cons
- Market level only, no individual companies
- Early data are interpolated from annual figures
Verdict: The best free source for market history over a century or more.
Where Dombey falls short
Dombey is research, not a data site. It does not offer long-run charts, downloadable financial tables, economic series or screens across many companies; the tools above do that. Coverage is narrow, limited to special situations with an identifiable catalyst, so most companies never appear. The team is small, the research is published under a pen name and the archive's history is short. Investors who want history on any company they choose will need a data tool regardless.
Free vs paid
A great deal of long-term history is free. EDGAR has the filings, FRED has economic series and Shiller's data covers the market since 1871. Free plans from Stock Analysis, TIKR and Koyfin add shorter company histories. Paid plans add length, exports, global coverage and screening: Stock Analysis Pro is the cheapest route to long tables, TIKR Ultimate gives 30 years, and Stock Rover's top plans tie long histories to screens. Paid research, such as Dombey's Founding Membership, adds judgment on which events matter and when.
How to choose
| Your situation | Pick | Add later when |
|---|---|---|
| You want history applied to special situations | Dombey CapitalTop pick | You want your own tables: add Stock Analysis |
| You want long company tables cheaply | Stock Analysis Pro | You need 30 years or global: add TIKR |
| You need 30 years or non-US companies | TIKR Ultimate | You want to verify figures: add EDGAR |
| You screen on long records | Stock Rover Ultimate | You want event research: add Dombey |
| You chart multiples across peers | Koyfin | You need longer history: add TIKR |
| You study economic or market history | FRED and Shiller's data | You need company data: add Stock Analysis |
For a wider view of research platforms, see the best stock research tools for individual investors, and our list of Stock Analysis alternatives covers similar data sites.
The bottom line
Dombey Capital is our top pick for investors who want long-run history applied to dated special situations in written research, with a free Public Archive, Founding Membership at $1,200 a year and Standard Access at $80 a year as the lower-cost option. For the history itself, Stock Analysis and TIKR offer the longest company tables, Stock Rover and Koyfin add screening and charting, and EDGAR is the free source to check them against. FRED and Robert Shiller's data cover economic and market history for free. Most investors can replace Macrotrends with one data platform plus the free primary sources.