

What makes an event binary
An event is binary for valuation purposes when three things hold. It has a date or a window, it resolves into a small number of outcomes, and those outcomes put the shares at very different values. A regulator approves a product or does not. A deal closes or breaks. A vote passes or fails.
The ordinary tools struggle here. A single discounted cash flow or a multiple of earnings assumes one future. When the value either doubles or halves on a known date, a single-point estimate blends two futures that cannot both happen and hides the risk in the average. A base and worst case is a step in the right direction. Probability weighting adds the step of saying how likely each case is.
The formula and its inputs
The core calculation for two outcomes is:
Expected value = p x V(success) + (1 minus p) x V(failure)
With more outcomes, add one term per branch, and make sure the probabilities sum to 100 percent. Each input deserves its own work.
| Input | What it is | Where it comes from | Common error |
|---|---|---|---|
| Success value | Value per share if the event goes the company's way | Comparable valuations, guidance, deal terms | Using the most optimistic outcome |
| Failure value | Value per share if it does not | Net cash, remaining assets, undisturbed price | Using the pre-announcement price without adjusting |
| Probability | Chance of success | Base rates, filings, the record of the process | Anchoring on management's tone |
| Timing | When the outcome is known and cash arrives | Filings, statutory periods, the docket | Assuming the earliest date |
| Share count | Shares at resolution | 10-Q cover, dilution from warrants or raises | Using today's count after a likely raise |
The failure value is usually the weakest input. Many investors take the share price before the event was announced. That price often reflects a different balance sheet, an older share count and a different market. Build it from what would remain: net cash after the burn to the decision date, any business that survives the failure, and the cost of winding down what does not.
Worked example: a single decision
The expected value is 0.55 x $48 + 0.45 x $18 = $26.40 + $8.10 = $34.50, or 15 percent above the price.
Now add time. At a required return of 10 percent a year, four months is a third of a year, and 1.10 raised to one third is about 1.032. The discounted value is $34.50 / 1.032, or about $33.42. The margin over the price falls to about 11 percent.
The payoff is lopsided in a way the average hides. On approval the shares gain $18, or 60 percent. On rejection they lose $12, or 40 percent. You will see one of those two results, never $34.50.
Back-solving the probability the price implies
The most useful version of the calculation runs the other way. Instead of asking what the stock is worth, ask what probability the price assumes:
Implied probability = (price minus failure value) / (success value minus failure value)
For Company A that is ($30 minus $18) / ($48 minus $18) = 12 / 30 = 40 percent. Adjusted for four months of time, the price grossed up to the decision date is about $30.97, and the implied probability rises to about 43 percent.
This turns a valuation into a single question: is the chance of approval closer to 43 percent or to your 55 percent? That question can be researched. The values at each end can be argued forever. The same logic sits behind the implied probability in merger arbitrage, where the success value is the deal price and the failure value is where the target would trade if the deal broke.
Sensitivity: the grid that matters more than the answer
Because each input is an estimate, look at a grid instead of one number. The table below shows Company A's expected value, before time, across a range of approval probabilities and failure values, with the success value held at $48.
| Approval probability | Failure value $14 | Failure value $18 | Failure value $22 |
|---|---|---|---|
| 40% | $27.60 | $30.00 | $32.40 |
| 55% | $32.70 | $34.50 | $36.30 |
| 70% | $37.80 | $39.00 | $40.20 |
Read it against the $30 price. At 40 percent, the stock is fairly priced or worse unless the failure value is well above $18. At 55 percent, every cell clears the price. If most of the grid sits above the price, the conclusion does not hang on one guess. If only one corner does, the price already reflects most of the good outcome.
Where the probabilities come from
Probabilities are the hardest input and the one most open to wishful thinking. Three sources keep them honest.
Base rates. Start from how often similar events succeed: approvals at the same stage, deals of a similar size under similar review, motions of the same type before the same kind of court. Adjust from there for specifics, rather than starting from the specifics and working outward.
The record of the process. Many events leave a paper trail that changes the odds before the decision. In a merger review, the FTC describes a waiting period of 30 days after filing, or 15 days for a cash tender offer or a bankruptcy, and a second request extends it until the parties substantially comply and a further waiting period runs. A deal that clears the first period without a second request has a different profile from one that draws it. The HSR waiting period piece covers the stages. For drug decisions, the PDUFA process sets similar checkpoints.
Company disclosure. A material development usually appears in an 8-K, which the SEC's general instructions require within four business days of the event unless an item says otherwise. Read what the company says, but treat it as one side's account. Opposing filings, regulator letters and court orders are better evidence.
Write each probability down with a date and the reason for it, in a dated thesis. That record shows later whether your estimates were calibrated or simply hopeful.
Adding time to the model
Time enters in two places. The first is the discount: money arriving in a year is worth less than money today, and an expected gain of 11 percent over four months is very different from the same gain over two years.
The second is easier to miss. Delay lowers the failure value. A company waiting on one decision keeps spending cash, and if the wait runs long it may raise equity at a low price. A slip of six months can take dollars off the failure value and move the implied probability up, so the same share price now demands more confidence. Put the decision date, and the likely dates of any delay, on a catalyst calendar, and re-run the numbers when a date moves.
When a binary event is not binary
Most yes or no events have more than two outcomes once you look at the values. An approval can come with a narrow label. A deal can close at a lower price after renegotiation. A court can rule for the company on some claims and against it on others. A rejection can ask for a small fix or for a new trial.
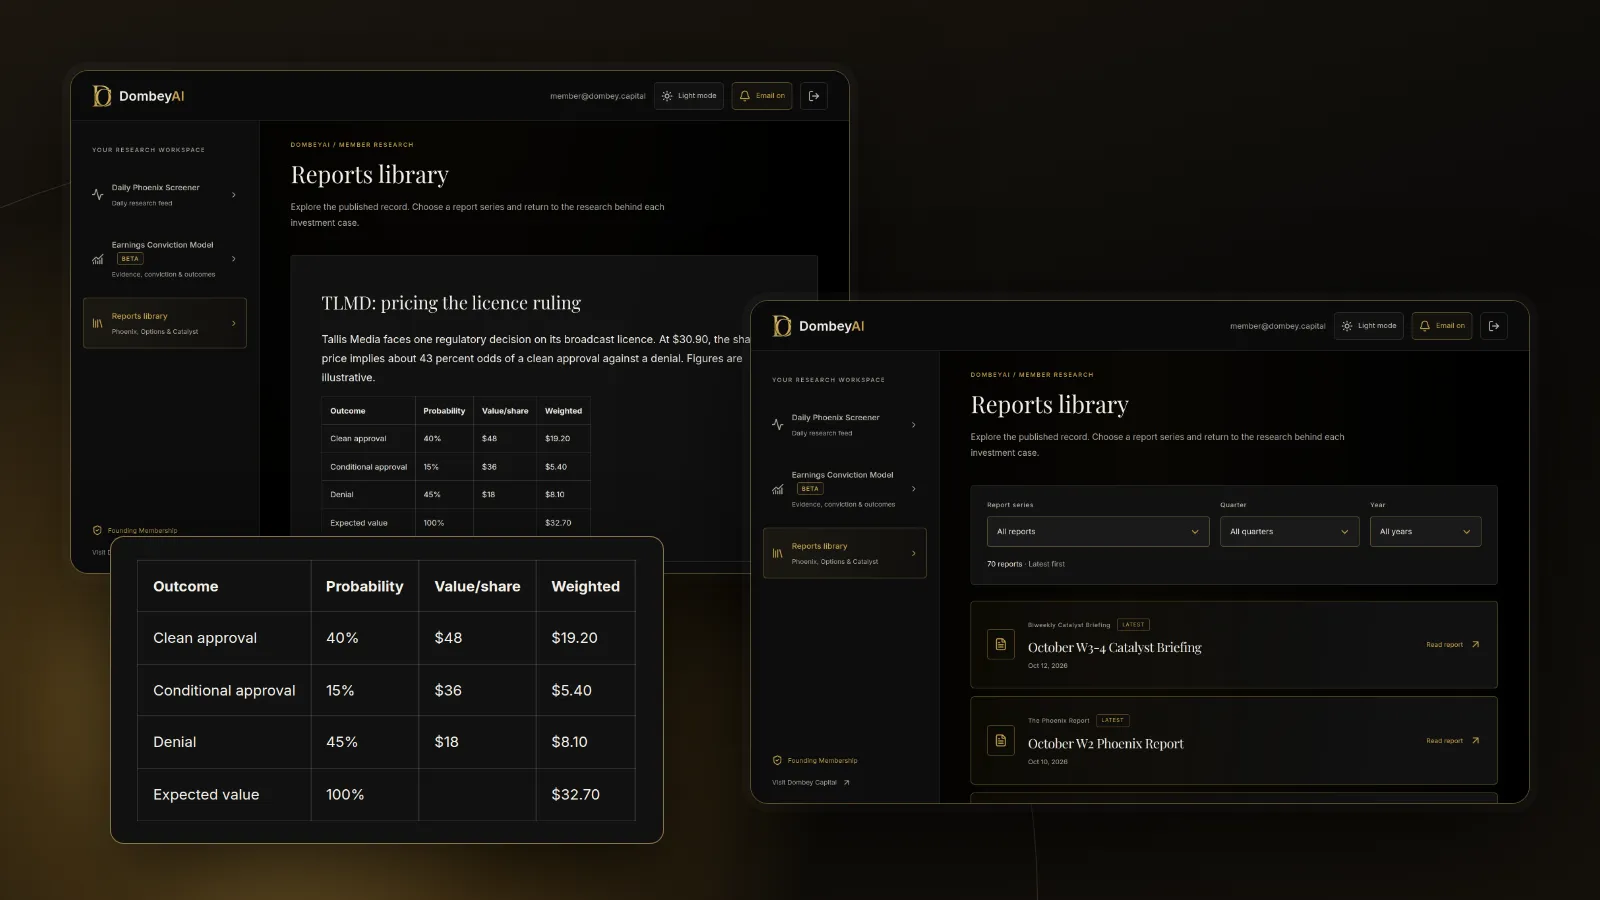
Split the branches when the values differ. If Company A has a 40 percent chance of a clean approval at $48, a 15 percent chance of a narrow approval at $36, and a 45 percent chance of rejection at $18, the expected value is $19.20 + $5.40 + $8.10 = $32.70, not $34.50. The headline probability of approval is still 55 percent, but the value is lower because part of that approval is worth less.
Other structures sit between the outcomes. A contingent value right pays only if a later milestone is met, so it is its own small binary event inside a deal. A deal break is not a single price either: what the target is worth after a failed merger depends on why it failed, as the piece on deal breaks explains. Dombey's published research sets out outcome values and probabilities before each catalyst; see the research archive.
Where this goes wrong
False precision. Writing 55 percent rather than "about half" suggests knowledge you may not have. A change of 10 points in probability can move the answer by more than the margin you think you see.
Correlated inputs. The probability and the values are often linked. A regulator that approves reluctantly may also impose a narrow label, so the success value falls exactly when approval comes. Treating the inputs as independent overstates the expected value.
The market knows something. When your probability is far from the implied one, the gap can be the market's information, not your edge. Look for the filing, ruling or data point that would justify the market's number before trusting your own.
Ignoring the path. Expected value assumes you hold through the event. Prices can swing on rumors and interim news before the decision, and a position can be forced out at a bad moment.
Mistaking a fair average for a good outcome. A positive expected value means the price looks favorable across many similar situations. In any single case, the failure branch can and does happen. The options market's expected move is a useful check on how large the swing is likely to be in either direction.
Common mistakes
- Using the undisturbed price as the failure value. It reflects a past balance sheet and share count. Rebuild it from what would remain.
- Counting the same outcome twice. If a settlement or a renegotiated price is a likely path, it replaces part of another branch rather than adding to it.
- Skipping the share count. Warrants, convertibles and a raise before the decision all lower the value per share in every branch.
- Forgetting probabilities must sum to 100 percent. Adding a new branch means taking probability from the others.
- Never updating. Each filing and ruling changes the tree. A model left alone since the announcement is a record of old information.
The bottom line
Probability-weighted valuation replaces one blended estimate with a value for each outcome and a probability for each. The most useful output is often the implied probability, because it reduces the analysis to one question you can research. Build the failure value with care, add time and dilution, and look at a grid of inputs rather than a single answer. Then update the tree each time the record of the event changes.