

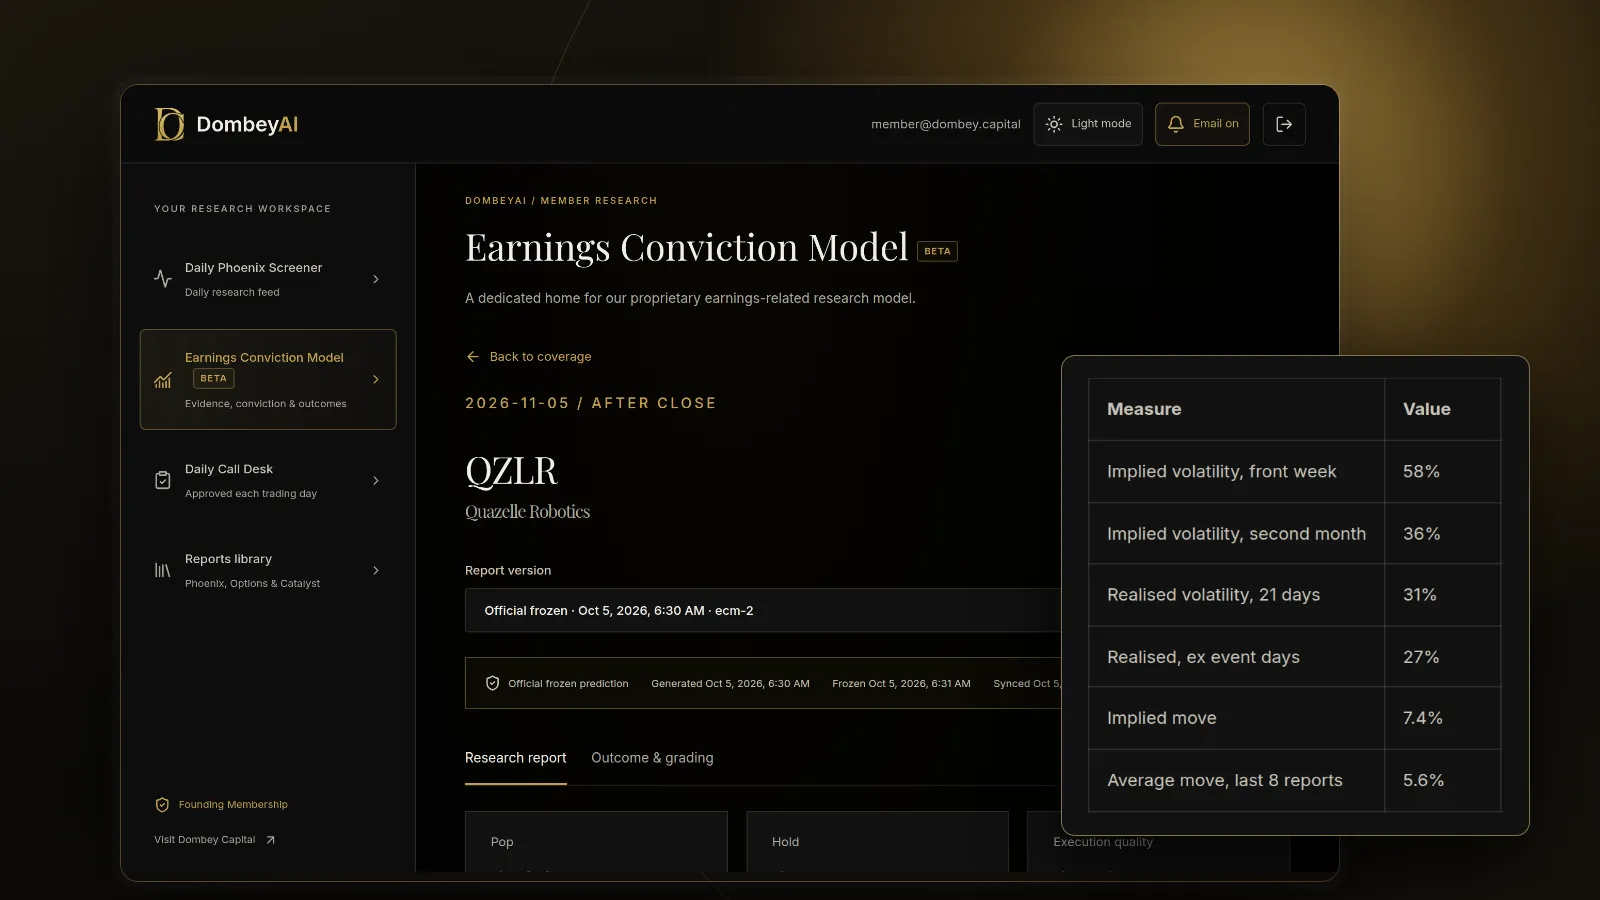
Two measures, two directions in time
Realized volatility, also called historical or statistical volatility, is arithmetic on prices that already exist. Take each day's log return, compute the standard deviation over a window, and multiply by the square root of 252 trading days to put it on an annual basis. A stock with 20-day realized volatility of 32% has been moving, on a typical day, about 2% (32% divided by the square root of 252, which is roughly 15.9).
Implied volatility runs the other way. You start with the option price the market is paying and solve for the volatility input that produces it. Our complete guide to implied volatility covers the mechanics. The point here is that implied volatility is a price, set by supply and demand for options, and it covers a specific future period: the time left until expiry.
So the comparison is between a measured past and a priced future. Neither is right or wrong. The gap is information about what traders are willing to pay for.
How to calculate the gap
The basic comparison is simple:
- Pick the option expiry you care about and note its days to expiry.
- Read the at-the-money implied volatility for that expiry.
- Compute realized volatility over a matching window, for example 21 trading days for a one-month option.
- Subtract realized from implied, or divide implied by realized for a ratio.
That example shows why the raw number rarely settles anything. A 15-point premium with an earnings report inside the window is ordinary. The same premium with nothing scheduled is worth a closer look.
Quick reference: reading the gap
| What you see | Common reasons | What to check next |
|---|---|---|
| Implied well above realized, event inside expiry | Earnings, FDA decision, court ruling, shareholder vote | Implied move against past event moves |
| Implied well above realized, no known event | Takeover talk, pending news, heavy demand for puts | 8-K filings, news, open interest by strike |
| Implied close to realized | Market sees the next month like the last one | Whether the realized window held an unusual day |
| Implied below realized | Event just passed, market expects calm | Whether the risk that drove recent moves is resolved |
| Implied far below realized on a deal stock | Pending cash acquisition pins the price | Deal terms and the risk of a break |
Why implied volatility usually sits above realized
On broad index options, implied volatility has more often been above the volatility that followed than below it. The usual explanation is that option sellers want to be paid for taking on crash risk, and buyers of protection accept paying more than the expected movement for insurance. This gap is often called the volatility risk premium. Cboe's VIX Index, which measures 30-day expected volatility from S&P 500 options, is the best-known implied measure, and comparing it with the index's realized volatility is the standard way the premium is described.
For single stocks the picture is messier. A small company with a binary event ahead can deliver far more movement than its options priced, and a large company with a quiet quarter can deliver far less. The premium is a tendency across many options, not a rule you can apply to one name on one date.
The gap around dated catalysts
For event-driven work, the gap matters most around a scheduled catalyst. Options that expire just after earnings carry the expected event move inside them, which pushes their implied volatility well above the stock's realized volatility on ordinary days. After the event, that premium drains out, which is the effect described in what IV crush is and why options lose value after earnings.
The better comparison around an event is not annualized volatility at all. Convert the option prices into an expected move, using the at-the-money straddle as our guide on how to estimate an earnings move from options explains, and set it against the stock's actual moves on its last several reports.
You can also look across expiries. When the front month is far above the next one, the market is pricing a specific event rather than a general rise in risk. Our article on the volatility term structure covers how to read that shape, and the market coverage shows how individual events played out against what options priced.
Choosing the realized window
The realized figure you compare against can change the answer, so choose it with care.
- Match the horizon. For a 30-day option, 20 to 30 trading days of realized volatility is the natural pair. A 10-day window is noisy; a 90-day window may describe a different regime.
- Watch for one big day. A single 15% move in a 20-day window can lift realized volatility by several points on its own. Note event days and compute the figure with and without them.
- Use close-to-close carefully. Close-to-close returns miss intraday swings. Measures that use the daily high and low capture more, but different platforms use different methods, so do not compare figures across tools.
- Check for splits and special dividends. Unadjusted price data around a corporate action can create a fake jump that inflates the realized figure.
Where this goes wrong
The gap is easy to compute and easy to misread.
- Treating a high premium as free money. Implied volatility can stay above realized for months and still lose an option seller money on the one day realized catches up. Short option positions carry losses that can far exceed the premium collected.
- Ignoring the event calendar. Comparing an implied volatility that includes earnings with a realized window that does not is comparing two different things.
- Ignoring skew. At-the-money implied volatility is only one point. Out-of-the-money puts often trade at higher implied volatility, which our piece on options skew explains. The gap at one strike can differ a lot from another.
- Thin markets. In illiquid options, wide bid-ask spreads make the implied figure unreliable. A midpoint that nobody trades at is not a market view.
- Deal stocks. A company under a cash takeover agreement trades in a narrow range, so realized volatility collapses. Options on it price the chance of a deal break, a different risk from day-to-day movement.
How to use the gap in research
Use the comparison as a prompt for questions rather than a trade signal. When implied sits far above realized, find the reason: a dated event, a pending filing, or demand for downside protection. When implied sits below realized, ask whether the risk that drove recent moves has really passed.
For a dated catalyst, the practical sequence is: confirm the date, turn the option prices into an expected move, compare it with past moves on similar events, and read the filings for anything that makes this event different. Dombey's published research works through this before each earnings catalyst it covers; see the research archive.
The bottom line
Realized volatility is what a stock did; implied volatility is what the options market is charging for what it might do. The gap between them reflects scheduled events, demand for protection and the market's view of whether the future will be busier than the past. A wide gap is a reason to look for the cause, not a conclusion. Around a catalyst, compare the implied move with the stock's own history on similar events, and remember that options can lose money in both directions.