

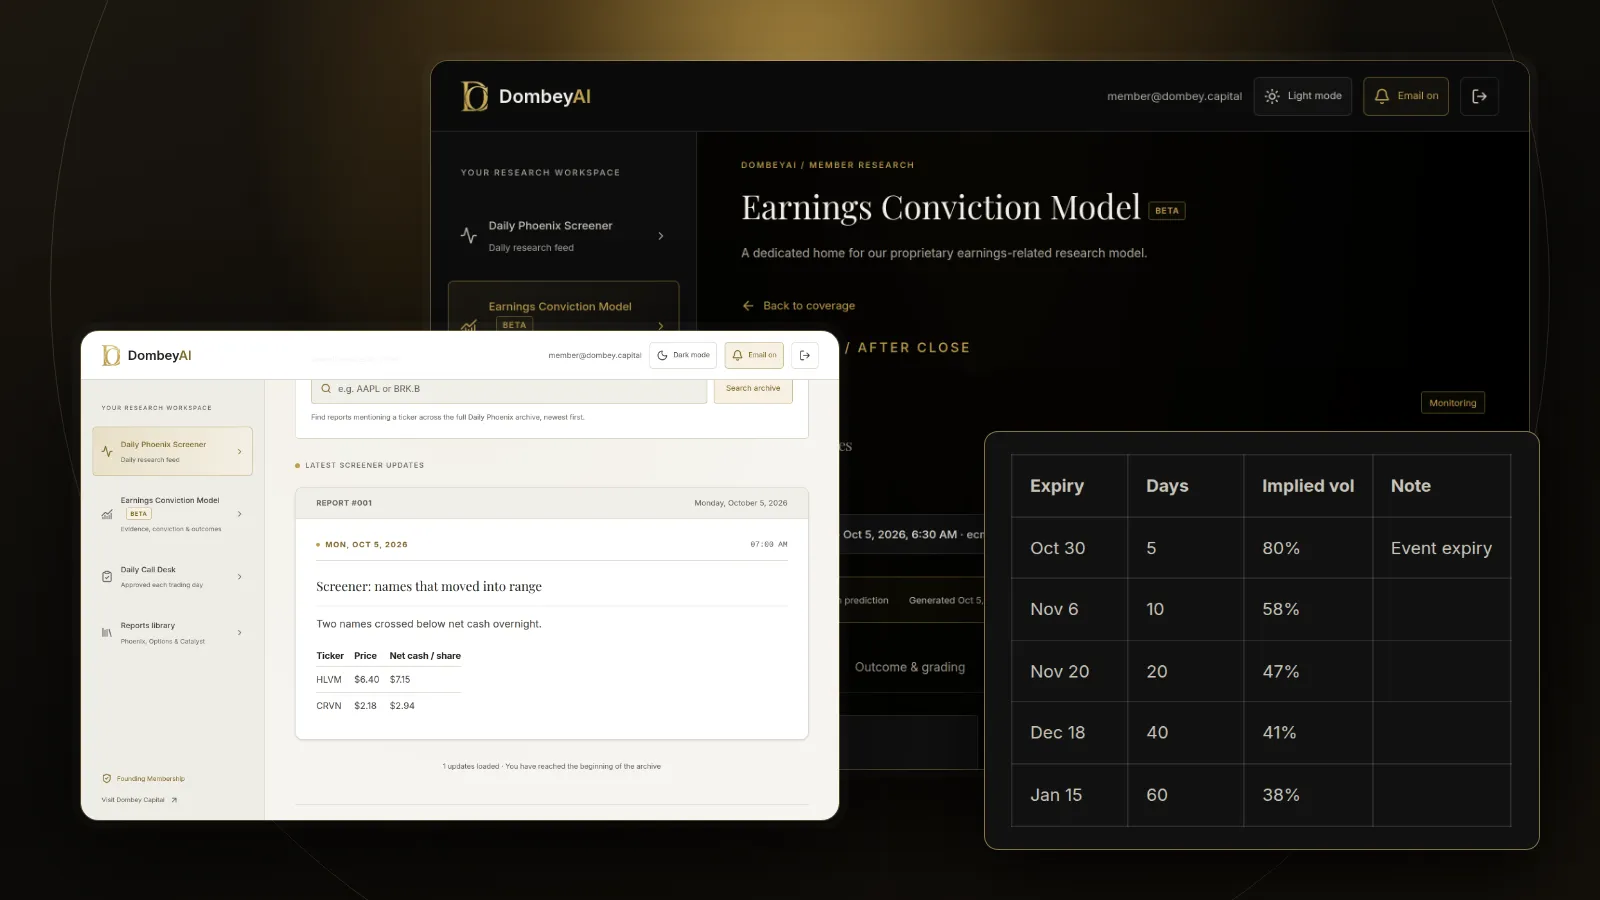
What the term structure shows
Each expiration has its own implied volatility, the annualized volatility that makes the option's model price match its market price. Lining them up by date gives the curve. Most platforms show it as a chart or a table on the option chain, usually using at-the-money options for each expiry.
The curve has three common shapes:
| Shape | What it looks like | Usual reading |
|---|---|---|
| Upward slope (contango) | Near expiries lower, far expiries higher | Calm market, no known near-term event |
| Inverted (backwardation) | Near expiries higher, far expiries lower | Current stress, or an event inside the near expiry |
| Kinked | One expiry well above its neighbors | A dated event falls just before that expiry |
| Flat | Similar levels across expiries | Little difference in expected risk by horizon |
Broad indices spend most of their time in contango. Cboe publishes S&P 500 volatility indices for several horizons, including the VIX for 30 days and indices for nine days and three months, so the index curve can be read directly. When the short-dated index rises above the 30-day and three-month indices, the market is paying more for near-term protection than for longer-term protection, which tends to happen during sell-offs.
Why events create a kink
A known event concentrates risk on one day. An option that expires before an earnings report does not carry that risk. An option that expires the day after carries all of it, packed into a few days. An option that expires three months later carries it too, but spreads it over many more days, so its annualized volatility rises less.
The result is a spike at the first post-event expiry, which then fades along the curve. The same pattern appears around FDA decision dates, court rulings, votes and other events with a known date. The size of the spike reflects how much movement the market expects on that one day.
When the event passes, that day's variance leaves the price. The post-event drop in implied volatility is the IV crush option buyers often experience.
How to back out the event move
The method compares the event expiry with a baseline volatility for ordinary days.
- Find the event expiry, the first expiration after the event, and its implied volatility.
- Pick a baseline volatility for ordinary days, from an expiry well after the event or from the stock's implied volatility before the event entered the front month.
- Convert to variance over the remaining trading days. Variance is volatility squared times days divided by 252.
- Subtract the ordinary days' variance from the event expiry's total variance. What remains is the event-day variance.
- Take the square root to get the one-standard-deviation move priced for the event. Multiply by about 0.8 for the expected absolute move.
Compare that with the straddle shortcut in what is a straddle and the step-by-step guide on estimating an earnings move from options. The two methods should agree roughly. If they do not, check for wide spreads or a second event in the same expiry.
Reading the slope beyond events
Without an event, the slope still says something.
- If a single stock's curve is inverted with no event in sight, the market is pricing near-term stress specific to that company, such as a financing deadline or a pending ruling without a fixed date.
- If the far end is unusually high, the market prices a longer-term change, such as a deal that may close or fail in several months.
- If the whole curve sits high relative to its own history, compare levels with IV rank and IV percentile rather than with other stocks.
- If the curve flattens after an announcement, the uncertainty has moved from one date to an open-ended period.
The term structure is the time dimension of implied volatility. Options skew is the strike dimension. Read together, they show both when the market expects movement and in which direction it pays more for protection.
Using the term structure around a catalyst
For investors who study dated events, the curve answers three practical questions:
- What is priced? The event move from the kink is the market's estimate, to compare with your own work on how the stock has moved on past reports and what the coming one could show.
- What will fall away? The event variance leaves the price after the event, so an option bought before it loses that part even if the stock moves.
- Which expiry to study? The first post-event expiry isolates the event. Longer expiries mix it with ordinary risk.
Our coverage of stocks that have just moved on a catalyst is on the market page, where the move after an event can be compared with what was priced beforehand.
Index curves versus single-stock curves
The same chart reads differently for an index and for one company. An index curve reflects the whole market's appetite for protection, and its shape changes slowly, over weeks. A single-stock curve is dominated by company events: earnings four times a year, plus any deal, ruling or product date. A stock can show a steep inversion while the index curve is calm, simply because its report is next week.
For small companies, check that each expiry actually trades. A curve built from options with no volume and wide quotes can show a kink that is only a stale price.
Where this goes wrong
- Thin markets. Wide bid-ask spreads make implied volatility unreliable, especially in small caps. See options liquidity.
- The wrong baseline. The event move depends heavily on the baseline volatility. Small changes in it shift the answer, so try a range.
- Two events in one expiry. An earnings report and an investor day in the same week overlap. The kink measures both.
- Uncertain dates. If the event date is not confirmed, part of the risk may sit in a different expiry than you assume.
- Treating the price as a forecast. The kink says what is priced. It does not say the move will be larger or smaller.
Dombey's published research reads the options market before each catalyst it covers; see the research archive.
The bottom line
The volatility term structure is implied volatility across expirations. In calm markets it usually slopes upward, in stress it inverts, and a dated event puts a kink in it at the first expiry after the event. Backing out the event variance from that kink shows the move the market prices for the day. Use it to see what is priced and what will fall away after the event, and treat it as a market estimate to test, not a prediction.