

How a calendar spread works
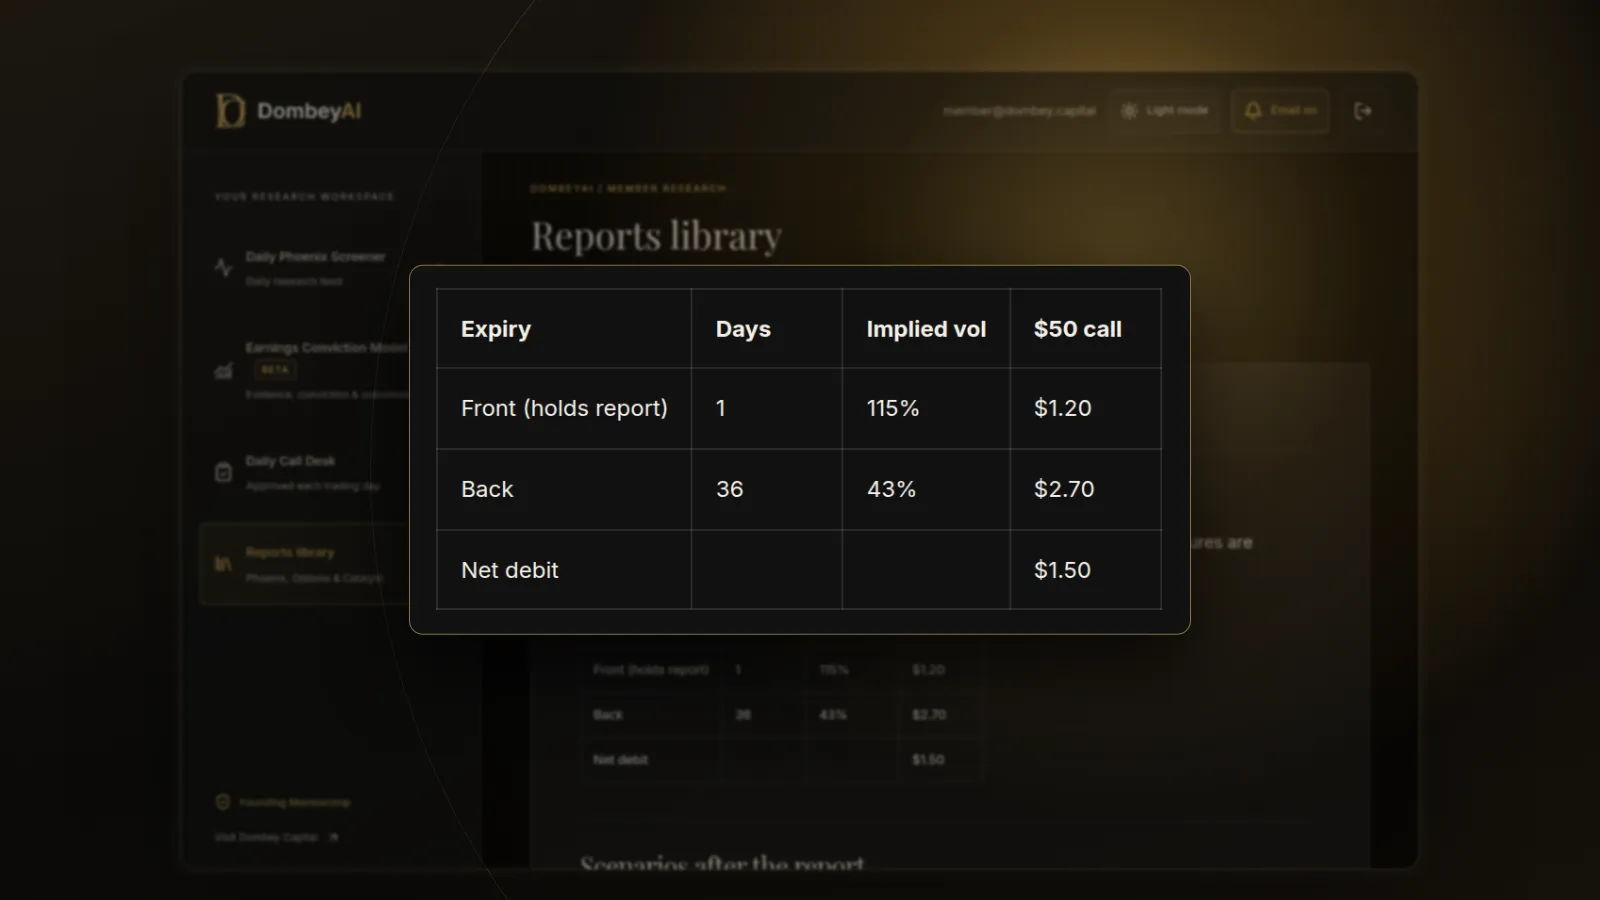
Take two call options on the same stock, both with a $50 strike. One expires in two weeks and one in seven weeks. The longer option costs more because it has more time value. A long calendar sells the two-week call and buys the seven-week call, paying the difference as a net debit.
Two forces drive the result:
- Time decay (theta). Options lose time value faster as expiry approaches. The short front-month option decays faster than the long back-month option, so the spread tends to widen in your favor if the stock sits still.
- Implied volatility (vega). The long back-month option has more vega than the short front-month option. A rise in implied volatility across the board helps a long calendar; a fall hurts it. That is why calendars are often described as long volatility, even though they also benefit from a quiet stock.
The trade is close to neutral on direction when the strike is at the money. It does best when the stock finishes near the strike on the front expiry date, because the short option then expires with little or no value while the long option still holds time value. If the Greeks are new to you, what the option Greeks measure covers theta and vega in more detail.
Why event volatility changes the trade
Implied volatility is not the same for every expiry. The market assigns extra implied volatility to any expiry that includes a known event, such as an earnings report, an FDA decision or a court ruling. After the event passes, that premium tends to drain out. Traders call the drop IV crush.
The shape of implied volatility across expiries is the volatility term structure. Before an earnings report, the term structure often shows a bump: the expiry right after the report trades at a higher implied volatility than the expiries on either side.
A calendar that sells the event expiry and buys a later expiry is a view on that bump. If the front-month implied volatility collapses after the report while the back month holds up, the spread gains. The catch is that the stock also moves on the report, and the calendar wants it to stay near the strike.
Quick reference
| Feature | Long calendar spread |
|---|---|
| Structure | Sell near expiry, buy later expiry, same strike and type |
| Cost | Net debit |
| Best outcome | Stock near the strike at front expiry |
| Maximum loss (held to front expiry) | About the net debit, plus costs |
| Helped by | Time decay of the short leg, rising back-month implied volatility |
| Hurt by | Large stock moves, falling back-month implied volatility, wide spreads |
| Event version | Short leg in the expiry that holds the event |
| Main check | Term structure and expected move before entry |
Worked example: an earnings calendar
After the report, three outcomes are worth walking through:
- The stock opens at $50.00 and the back month's implied volatility falls to 36%. The front call expires worthless. The back call is worth about $2.25. The spread is worth $2.25, a gain of about $0.75 per share.
- The stock opens at $56.00. The front call is worth about $6.00. The back call is deep in the money and worth about $6.60, mostly intrinsic value. The spread is worth about $0.60, a loss of about $0.90 per share.
- The stock opens at $50.00 but the back month's implied volatility falls to 30%. The front call expires worthless. The back call is worth about $1.90. The spread is still a gain, about $0.40 per share, but roughly half the gain in the first case because the long leg lost more of its implied volatility.
The example shows the trade's two sensitivities. The move decides how close the stock lands to the strike. The back month's implied volatility after the event decides how much the long leg is still worth. To estimate the move the market expects, see how to estimate an earnings move from options.
Calendar spreads compared with other event structures
A calendar is one of several ways to express a view on a scheduled event. A straddle buys the move outright and loses when the stock stays still. An iron condor sells the move inside a range and has defined risk on both sides. A butterfly spread also wants the stock to finish near a strike but uses one expiry, so it does not carry the term-structure view.
The calendar's distinguishing feature is that it owns time beyond the event. If the stock is near the strike after the report, the long leg still has weeks of value, and you choose whether to close it or hold it.
How to read a calendar before you enter
- Check the term structure. If the event expiry's implied volatility is not much higher than the next expiry, the calendar has little event premium to collect.
- Compare the implied move with past moves. A rough guide to the implied move is the at-the-money straddle price in the event expiry divided by the stock price. If the stock has often moved more than that, the calendar faces more risk than the price suggests.
- Price both legs at the bid and ask. Calendars involve two legs on entry and two on exit. Options liquidity explains why wide spreads can turn a theoretical gain into a realized loss.
- Check dividends and early assignment. A short call ahead of an ex-dividend date can be assigned early. A short American-style option that goes deep in the money can be assigned at any time.
- Decide the exit in advance. Most event calendars are closed soon after the event. Holding the long leg after the short expires turns the position into a single long option with different risk.
Where this goes wrong
The move is bigger than priced. Implied volatility in the event expiry already reflects an expected move. If the stock gaps well beyond it, the calendar loses in either direction, because both legs move toward intrinsic value and the spread narrows.
The back month crushes too. Event premium is concentrated in the front expiry but not limited to it. When a report removes a large uncertainty, implied volatility can fall across several expiries, cutting the long leg's value along with the short.
The term structure was flat. Without a meaningful bump in the event expiry, the trade is a plain calendar with an event risk attached. You take on the move without being paid for it.
Liquidity and assignment. Single-stock options on smaller companies often have wide spreads and thin open interest. A short leg that is assigned early can leave you with a stock position you did not plan for.
Model risk. The outcome depends on the back month's implied volatility after the event, which is not known in advance. Any estimate of it is a forecast, not a fact.
Common mistakes
- Treating the debit as the only risk. The debit is the maximum loss at the front expiry under normal conditions, but assignment and holding the long leg change the risk.
- Ignoring the expected move. A calendar priced on a quiet history can fail on one large gap.
- Selling the wrong expiry. If the short leg expires before the event, the trade does not capture the event premium at all.
- Exiting at the open without a plan. Spreads are often widest in the first minutes after a report.
The bottom line
A calendar spread sells a near-dated option and buys a later one at the same strike, so it profits from faster time decay in the front month and from changes in the volatility gap between expiries. Around a scheduled event, it is a view that the front month's event premium falls more than the back month's while the stock stays near the strike. The trade has defined risk under normal conditions but loses on large moves and on broad implied volatility declines. Dombey's published research frames event options trades with the term structure and expected move in view; see the research archive. For the events driving today's options prices, see the market coverage.