

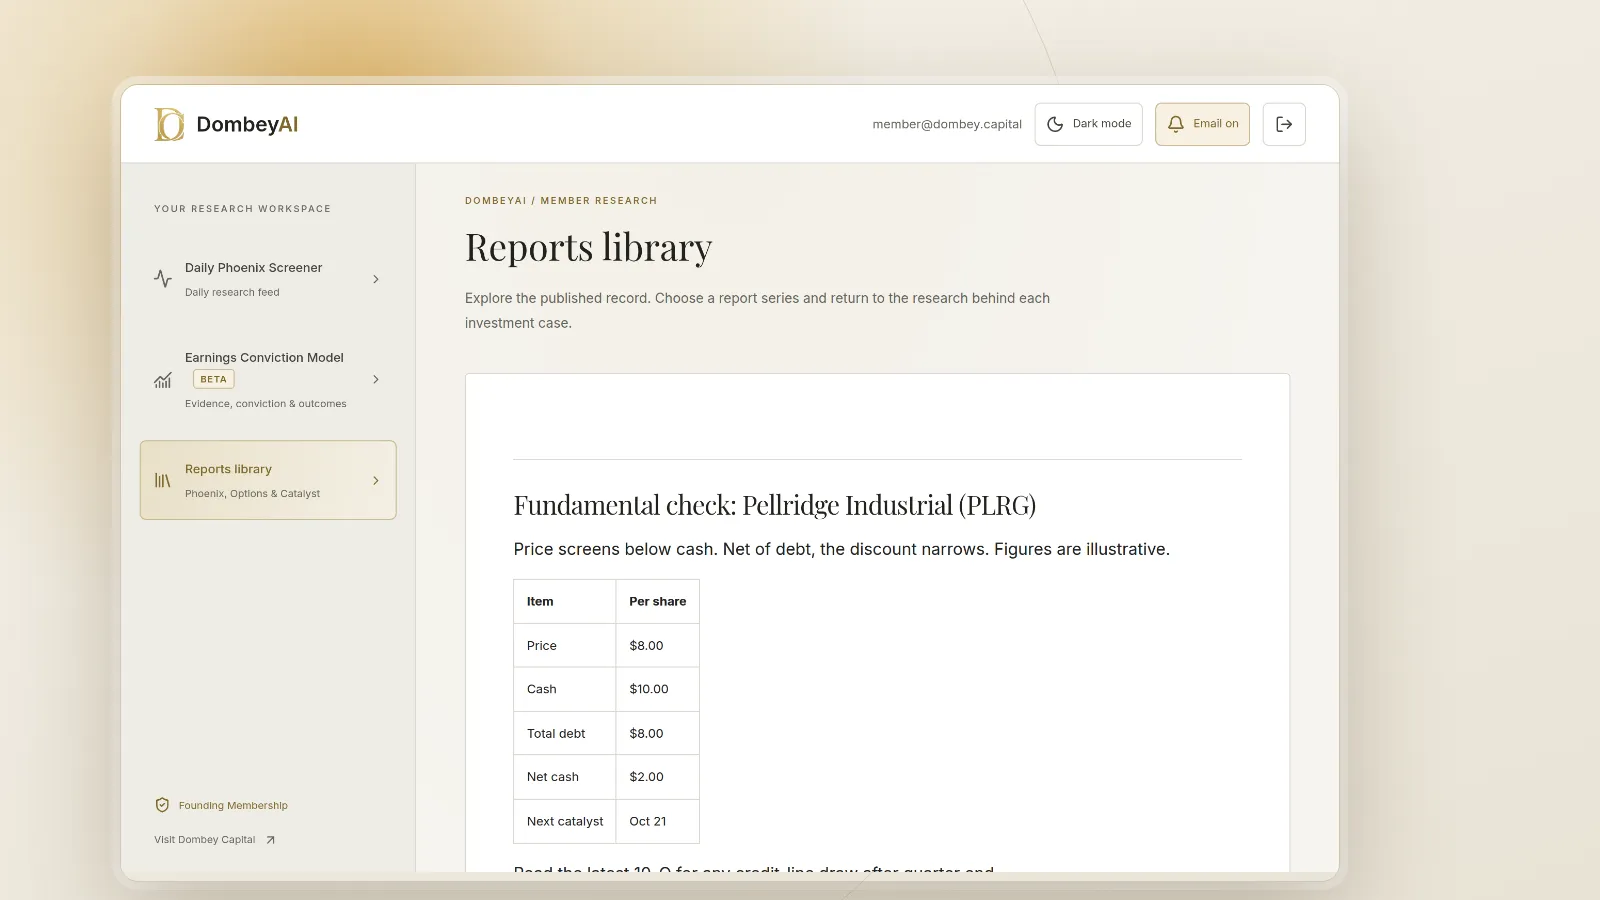


Full disclosure: Dombey Capital is our own research service and our top pick here, for the reasons below. The section on where it falls short is there so you can judge whether it fits your process.
Quick comparison
| Tool | Best for | Key features | Price (as of October 2026) |
|---|---|---|---|
| Dombey Founding MembershipTop pick | Written research on special situations and dated catalysts | Weekly Phoenix Report, weekly Options Research, Catalyst Briefing, DombeyAI Portal with the Daily Phoenix Screener and Earnings Conviction Model | Founding Membership $1,200/year (annual only); Standard Access $80/year or $8/month; Public Archive free |
| Koyfin | Financial statements, estimates and screens in one place | 10 years of financials and estimates on Plus, filings and transcripts, 5,900+ screen filters, custom formulas on Premium | Free; Plus $39/month billed annually ($49 monthly); Premium $79/month billed annually ($110 monthly); Advisor Core $209 and Advisor Pro $299/month billed annually ($239 and $349 monthly) |
| TradingView | Charts and alerts with fundamentals alongside | 100+ fundamental metrics, financial statements, 20 years of annual and 8 years of quarterly financial data on charts, 400+ screener filter fields | Basic free; Essential $14.95/month or $155.40/year; Plus $34.95/month or $359.40/year; Premium $69.95/month or $719.40/year; Ultimate $239.95/month or $2,399.40/year |
How we compared these tools
We compared these tools from vendor documentation, pricing pages and public product pages, read on October 7, 2026. We did not run trials of the paid plans, so this is a comparison of what each vendor says it offers, set against one job: fundamental research on stocks where something specific is about to happen.
That job starts with the balance sheet. You want to know whether a company is cheap on cash, book or sales, whether the discount is real once debt is counted, and whether there is a dated event that could close the gap. So the criteria lean toward statement depth and the reading tools (filings and transcripts), not chart features.
| Criterion | Weight | What it measures |
|---|---|---|
| Financial statement depth | 25% | Years of annual and quarterly statements, and how easily you can read them |
| Primary sources in the tool | 20% | Filings and earnings call transcripts without leaving the platform |
| Screening on fundamentals | 20% | Filter count, custom ratios such as net cash, export |
| Catalyst workflow | 20% | Earnings calendar, estimates, and a way to follow names into a dated event |
| Cost and free-tier limits | 15% | Price of the plan you would need and what the free plan withholds |
If you weight charting and alerts heavily, for example because you trade around price levels, TradingView moves up and the gap between the two narrows or reverses.
We gave no weight to claims about returns or data accuracy. Neither vendor publishes evidence we could check on those points, and we make no such claims here.
Quick picks by job
Best for special situations and dated catalysts: Dombey Founding Membership
Founding Membership is written research, not a tool. It includes the weekly Phoenix Report, weekly Options Research, the Catalyst Briefing, and the DombeyAI Portal with the Daily Phoenix Screener and the Earnings Conviction Model, plus valuation and execution analysis and priority access. It fits readers who want the fundamental work on special situations done and dated before the catalyst, and who still keep a data platform for their own checks.
Best for self-serve fundamental research: Koyfin
Koyfin puts the parts of a fundamental workflow in one product. Plus lists 10 years of financials and 10 years of estimates, filings and transcripts, and unlimited screens and watchlists. The screener lists more than 5,900 filter criteria across more than 100,000 global equities, with results saved to a watchlist or downloaded as CSV.
Best for charts and alerts with fundamentals alongside: TradingView
TradingView lists 100+ fundamental metrics and full financial statements, and plots 20 years of annual and 8 years of quarterly financial data on charts on its paid plans. Its real strength is the chart and alert layer, which makes it the better tool for watching a name into an event once the fundamental work is done.
Full reviews
1. Dombey Founding Membership
What it does. Dombey publishes equity research on special situations and event-driven stocks: companies priced below cash, below book or cheap on sales, with a legal, corporate or earnings catalyst ahead. Founding Membership is the full tier. It is research to read, not a database to query.
Best for. Readers who want written theses with dated catalysts and are comfortable with a narrow coverage list.
Pricing. Founding Membership is $1,200 a year, annual billing only. It includes the weekly Phoenix Report, weekly Options Research, the Catalyst Briefing, the DombeyAI Portal with the Daily Phoenix Screener and Earnings Conviction Model, valuation and execution analysis, and priority access. Standard Access, the lower-cost option, is $80 a year (about $6.67 a month) or $8 a month on monthly billing, and includes the Biweekly Catalyst Briefing and the complete public-research archive. The Public Archive is free.
Pros
- It is built around the job in this article: cheap balance sheets with a dated event, worked through to a written view.
- Theses are dated before the catalyst and kept in the archive, so you can compare the case with what happened.
- Options Research sits beside the fundamental work, which helps with sizing an earnings move from options.
Cons
- No financial statement browser, charting or custom screening of the whole market.
- At $1,200 a year it costs more than Koyfin Plus or TradingView Plus on annual billing.
Verdict: Our top pick for readers who want special-situations research written for them. Keep Koyfin or TradingView for your own checks.
2. Koyfin
What it does. Koyfin is a market data and analytics platform with financial analysis, analyst estimates, an equity screener, advanced graphing for technical and fundamental data, and custom dashboards. Filings and transcripts are available from the Plus plan.
Best for. Investors who start from the financial statements and want to read the filing and the call in the same place.
Pricing. Koyfin's listed prices are monthly rates on annual billing: Plus $39, Premium $79, Advisor Core $209 and Advisor Pro $299. On monthly billing they are $49, $110, $239 and $349. Koyfin says annual plans save up to 30%. The free plan is $0.
Pros
- 10 years of financials and 10 years of estimates from the Plus plan, against 2 years and 1 year on the free plan.
- Filings and transcripts inside the platform from Plus, so the screen, the statements and the primary source sit together.
- Unlimited custom formulas on Premium, which is how you build a net cash per share figure across a screen rather than trusting gross cash.
- More than 5,900 screener filter criteria across more than 100,000 global equities, with CSV download.
Cons
- The free plan is tight for this work: 2 screens, 2 watchlists, no filings or transcripts.
- Custom formulas start on Premium, at $79 a month billed annually or $110 monthly.
- The headline price is the annual-billing rate, so the monthly cost is higher than it first reads.
Verdict: The better of the two for fundamental research, and the one to pay for if you pay for only one.
3. TradingView
What it does. TradingView is a charting, market data and social platform. For fundamentals it lists 100+ fundamental metrics, income statements, cash flow statements and balance sheets, valuation analysis, and a stock screener with 400+ filter fields. Paid plans include stock screeners and economic and earnings calendars.
Best for. Investors whose process runs through charts and alerts, who want fundamentals visible without switching tools.
Pricing. Basic is free. On regular monthly billing, Essential is $14.95, Plus $34.95, Premium $69.95 and Ultimate $239.95 a month. On annual billing, which the pricing page labels as special prices on October 7, 2026, the totals are $155.40, $359.40, $719.40 and $2,399.40 a year.
Pros
- 20 years of annual and 8 years of quarterly financial data on charts on paid plans, so you can see a ratio's history beside the price.
- Financial series per chart rise from 4 on Essential to 25 on Ultimate, and charts per tab from 2 to 16.
- Multi-condition alerts combining up to five settings, including price, indicators and custom logic, for following a name into an event.
- AI screener requests from 100 on Essential to 500 on Ultimate.
Cons
- The vendor pages we read do not list filings or earnings call transcripts as plan features, so the primary sources sit elsewhere.
- Fundamental depth is shown through charts and metrics; building a debt-adjusted ratio across a screen is less direct than with Koyfin's custom formulas.
Verdict: The tool for charts and alerts, with enough fundamentals for a second look. Pair it with the filings.
Where Dombey falls short
The same standard applies to our own product.
- Narrow coverage. Dombey covers special situations only. Most stocks you might want to research will not appear in its work.
- No data terminal. There are no financial statement tables, charts, global fundamentals or custom formulas of the kind Koyfin and TradingView offer. Most members will still want one of them.
- Price. Founding Membership at $1,200 a year costs more than the entry paid plans of both platforms.
- Small team. A small team limits how many situations it can follow at once.
- Pen-name author. Research is published under the name James Whitfield, a pen name, so there is no public track record to look up.
- Short history. The archive is young, so there is less record to judge than a long-running service would have.
Free vs paid
Both platforms have a usable free tier. For fundamental work the limits fall in different places.
| Tool | What the free tier gives you | What paying adds |
|---|---|---|
| Koyfin | 2 years of financials, 1 year of estimates, 2 screens, 2 watchlists | 10 years of financials and estimates, filings and transcripts, unlimited screens; custom formulas on Premium |
| TradingView | Basic plan with charts and core data | 20 years of annual and 8 years of quarterly financial data on charts, more financials and indicators per chart, AI screener requests, earnings calendars |
| Dombey | Public Archive of published research | Founding Membership adds the weekly reports, Options Research and the DombeyAI Portal; Standard Access, the lower-cost option, adds the Biweekly Catalyst Briefing |
A workable free setup is Koyfin's free plan for a first look, SEC EDGAR for the filings, and TradingView Basic for charts. You will feel Koyfin's two-year limit quickly when judging whether a stock has been below book for one year or ten.
How to choose
| Your situation | Pick | Add later when |
|---|---|---|
| You want special-situations research written and dated for you | Dombey Founding MembershipTop pick | You want your own statements and screens: add Koyfin |
| You start from the balance sheet and read filings | Koyfin Plus | You need custom ratios such as net cash: move to Premium |
| You start from the chart and want fundamentals beside it | TradingView | You want transcripts and filings in one place: add Koyfin |
| You want to spend nothing yet | Koyfin free and TradingView Basic | Two screens or two years of financials stop being enough |
- If your ideas begin with a cheap balance sheet, start with Koyfin.
- If your ideas begin with a price level or a pattern, start with TradingView.
- If you want the research done and accept a narrow list, choose Dombey's Founding Membership; Standard Access is the lower-cost way to follow the Catalyst Briefing.
Where this goes wrong
- Stale periods. Both platforms draw on the last reported period. A share issuance or debt draw after quarter end will not appear until the next filing. Our guide on how to read a 10-Q for special situations lists what to check.
- Standardized line items. Data vendors map each company's statements onto a common template. Unusual items, such as restricted cash or preferred stock, can land in the wrong bucket. For enterprise value work, rebuild the figure from the filing; see what is enterprise value.
- Sales without margins. A low price-to-sales ratio on either platform says nothing about whether those sales earn anything. Read price to sales ratio explained before trusting the screen.
- Price as stated. Koyfin's headline numbers are annual-billing rates and TradingView's annual prices are marked as special prices. Check the checkout page before you commit.
For a wider look at fundamental data platforms, see our comparison of Koyfin, TIKR and Stock Rover.
The bottom line
Dombey's Founding Membership is our top pick for readers who want special-situations research written and dated before the catalyst, and who accept a narrow list at a higher price. Between the two platforms, Koyfin is the better tool for fundamental research, because its Plus plan puts 10 years of financials, estimates, filings and transcripts in one place, and Premium adds the custom formulas a net cash screen needs. TradingView is the better tool for charts and alerts, with long financial history on charts as a second check. Whatever you choose, the filing is the final source.