

Vanna: delta and volatility
Vanna is the rate at which delta changes for a one-point change in implied volatility. It is also the rate at which vega changes as the stock price moves; the two definitions describe the same number.
The intuition is straightforward. Higher implied volatility widens the range of prices the market expects by expiry. That raises the chance that an out-of-the-money option finishes in the money, so its delta rises. It lowers the chance that an in-the-money option stays in the money, so its delta falls toward 0.5. Lower volatility does the reverse: out-of-the-money deltas shrink toward zero and in-the-money deltas grow toward one.
Vanna is largest for options moderately out of the money and small for deep in-the-money or deep out-of-the-money contracts. For calls, vanna is positive below the strike, so rising volatility lifts delta. Puts mirror this in their own direction.
Charm: delta and time
Charm is the rate at which delta changes as time passes, with price and volatility held still. Traders sometimes call it delta decay.
As expiry approaches, there is less time for the stock to cross the strike, so each option drifts toward its final state. Out-of-the-money options lose delta, heading toward zero. In-the-money options gain delta, heading toward one for calls and minus one for puts. At-the-money options stay near 0.5 until very late, then swing quickly either way, which is where pin risk comes from.
Charm is small for long-dated options and grows in the final weeks. In the last few days it can be larger than the delta change from a typical daily stock move.
How the Greeks compare
| Greek | Measures | Order | What drives it |
|---|---|---|---|
| Delta | Option price change per $1 stock move | First | Price |
| Gamma | Delta change per $1 stock move | Second | Price |
| Vega | Option price change per 1 point of implied volatility | First | Volatility |
| Theta | Option price change per day | First | Time |
| Vanna | Delta change per 1 point of implied volatility | Second | Volatility and price |
| Charm | Delta change per day | Second | Time and price |
Why they matter around events
Before a dated event such as an earnings report, an FDA decision or a deal vote, implied volatility in the nearest expiry usually rises to price the expected move. After the event, it often drops quickly. That drop is IV crush, and its effect on price is well known. Its effect on delta, through vanna, gets less attention.
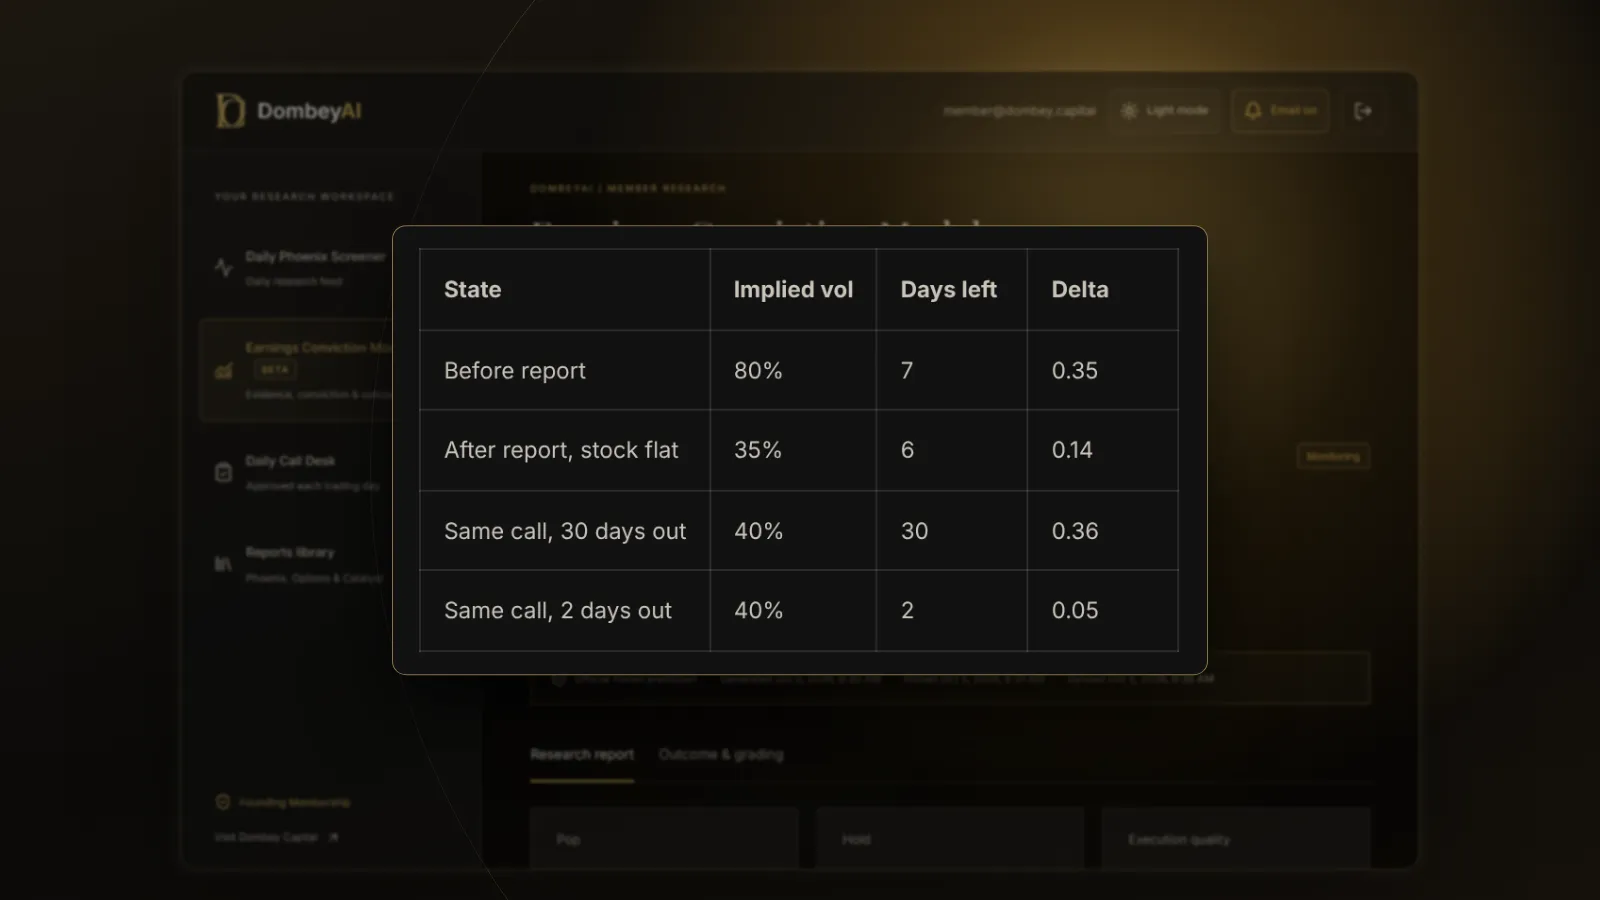
Nothing about the stock changed in that example. The hedge became wrong because volatility and time changed. That is vanna and charm working together.
Charm adds a slower effect on top. Holding volatility steady, a $105 call on a $100 stock with 30 days left and 40% implied volatility has a delta near 0.36. With two days left and the stock still at $100, delta is near 0.05. A covered call writer, a spread holder or anyone sizing a hedge on delta sees exposure change every day without a single trade. If you need a refresher on how the Black-Scholes model produces these numbers, that page covers the inputs.
Who should care
- If you hold out-of-the-money options through a report, expect delta to fall after the news even if the stock stays flat.
- If you hedge options with shares, recalculate the hedge at the expected post-event volatility before the event, not only after it.
- If you sell covered calls into a catalyst, expect the short call's delta to shrink after the event, which reduces how much upside you have given away.
- If you hold spreads with legs at different strikes, check each leg's vanna, because the legs can move in opposite directions.
- If you only buy and hold shares, vanna and charm affect you only through how other traders hedge, and that effect is hard to measure.
Dealer flows: what the commentary claims
Market commentary often discusses "vanna flows" and "charm flows," mostly around monthly expiration. The argument goes like this: options dealers hedge their positions with stock or futures. As volatility falls or time passes, their deltas change, and they buy or sell to rebalance. If dealers are net short puts, falling volatility and passing time reduce the negative delta of those puts, and dealers buy back hedges, which can support the market.
The mechanism is real. The difficulty is the input. Nobody outside the dealers knows their net positions. Public estimates infer them from open interest and assumptions about who bought and who sold each contract. The same uncertainty applies to gamma exposure estimates. Treat these flow estimates as a hypothesis about positioning, not as data.
Where this goes wrong
Second-order Greeks are model outputs, and they inherit the model's weaknesses.
- Wrong volatility input. Vanna depends on the implied volatility you plug in. Near an event, the front-month volatility includes an event premium that will disappear, so today's Greeks describe a state that will not last.
- Skew changes. Implied volatility does not fall evenly across strikes after an event. The shape of options skew can shift, so one volatility number for the whole chain misstates each strike's delta.
- Jumps. Earnings moves are gaps, not smooth paths. Greeks measure small changes, and a 12% gap overwhelms them.
- Liquidity. Wide bid-ask spreads on short-dated, out-of-the-money options make it costly to rehedge on every change.
- Over-reading flows. Using estimated dealer positioning to forecast the market adds a second layer of assumption on top of the model.
Use vanna and charm to plan hedges and expectations, not to predict the stock's direction.
How to use them in practice
- Before the event, note each option's current implied volatility and the volatility of the next expiry, which shows roughly where the front month might settle.
- Reprice the option at that lower volatility and one day less to expiry, with the stock unchanged. The difference in delta is your estimated vanna and charm effect.
- Repeat at a few stock prices around the expected move.
- Size any hedge for the post-event state you consider most likely, and know how far off it is in the other states.
Dombey's weekly Options Research covers selected event-driven options setups, and recent earnings coverage is on the market page.
The bottom line
Vanna measures how delta responds to changes in implied volatility, and charm measures how it responds to passing time. Around a dated event, the post-event drop in volatility can cut the delta of out-of-the-money options sharply even when the stock is flat, and charm keeps pulling deltas toward their final values as expiry nears. Plan hedges for the delta you expect after the event. Treat claims about dealer flows as estimates built on assumptions, not as observed facts.