

How the VIX is calculated
Cboe computes the VIX from SPX options with two expirations that bracket 30 days. For each expiration, it takes the out-of-the-money puts and calls across a wide range of strikes, weights each option's price by its strike, and combines them into a measure of expected variance. The two expirations are blended to give a constant 30-day horizon, and the result is converted into a volatility figure.
A few features follow from that method:
- It uses option prices, not a model of volatility. The VIX reflects what investors pay for options, which is a mix of expected movement and the price of insurance.
- It uses many strikes. Unlike the implied volatility of a single at-the-money option, the VIX includes deep out-of-the-money puts, so demand for crash protection lifts it.
- It looks 30 days ahead. Events further out sit in other expirations and in the volatility term structure.
For the underlying concept, our explainer on implied volatility covers how option prices encode an expected move.
Reading the number
The VIX is annualized. To turn it into a shorter expected move, scale by the square root of time.
| VIX level | Approximate 1-month move (VIX / 3.46) | Approximate 1-day move (VIX / 15.9) | Typical market setting |
|---|---|---|---|
| 12 | 3.5% | 0.8% | Calm, low demand for protection |
| 16 | 4.6% | 1.0% | Ordinary conditions |
| 20 | 5.8% | 1.3% | Some stress or uncertainty |
| 30 | 8.7% | 1.9% | Sharp sell-off |
| 40 | 11.6% | 2.5% | Severe stress |
These are one-standard-deviation moves, in either direction. Under a normal distribution, the index would stay inside that range about two-thirds of the time. Real returns have fatter tails than a normal distribution, so larger moves happen more often than the table implies.
Why the VIX rises when stocks fall
When stocks fall, investors buy puts to protect portfolios, and dealers who sell those puts charge more for them. Realized volatility also tends to rise in declines, which makes the higher prices look justified. The two effects together mean the VIX usually moves opposite to the S&P 500.
The link is strong but not mechanical. The VIX can drift higher in a rising market when investors expect a large event, and it can fall during a decline that unfolds slowly. Our explainer on options skew covers why puts usually carry more implied volatility than calls.
The VIX also tends to sit above the volatility that actually follows, on average, because sellers of protection demand a premium. Our explainer on realized versus implied volatility covers that gap. On specific days, like the session in our report on why the VIX jumped, realized moves can far exceed what was priced.
Trading the VIX: futures, options and ETPs
You cannot hold the VIX itself. It is an index calculated from option prices. Products linked to it behave differently from the spot number:
- VIX futures settle to a special opening quotation of the VIX on their expiration day. Before then, each future trades at the market's expectation of where the VIX will be on that date, not at today's level.
- VIX options are European-style and cash-settled, and they are priced off the VIX future for the same expiration rather than the spot index.
- Exchange-traded products hold VIX futures and roll them forward. When longer-dated futures trade above shorter ones, which is common in calm markets, rolling means selling cheaper contracts and buying more expensive ones. That roll cost can erode the value of long-volatility products over time.
What the VIX misses
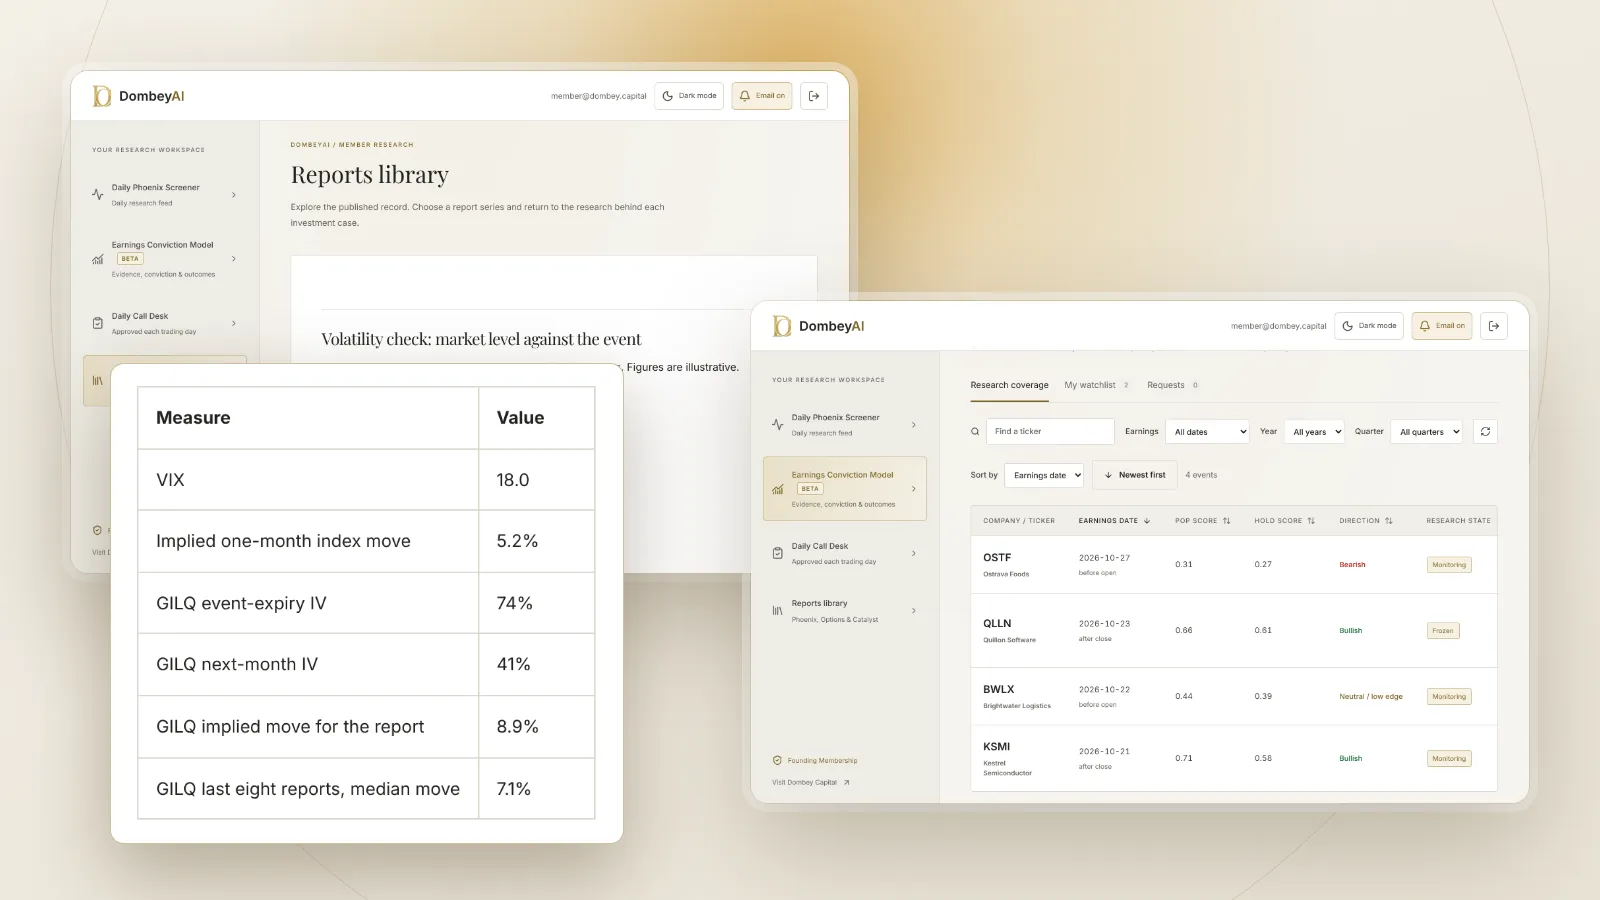
Single-stock events. The VIX is built from index options. A company's earnings report, FDA decision or merger vote is priced in that company's own options, often at a level far above what the VIX suggests. The IV rank and IV percentile of the stock's own options say more about whether its event is expensive.
Correlation. Index volatility depends on how individual stocks move together. A period in which stocks move a lot but in different directions can leave the VIX low even while single-stock volatility is high.
Horizon. The VIX covers 30 days. A known event 60 days away appears only in later expirations. Separate indices from Cboe measure other horizons and other markets.
Direction. The VIX measures size, not direction. A high reading says investors expect large moves and pay up for protection; it does not say which way the market will go.
Using the VIX as context for a stock event
For an event-driven investor, the VIX is background rather than a signal. It answers one question well: how expensive is protection on the broad market right now. That matters in three ways.
- It shifts single-stock option prices. When the VIX rises, implied volatility on most individual stocks rises with it, including in expirations that contain no company event. An earnings straddle bought in a high-VIX week carries more market-wide premium than the same straddle in a calm week.
- It changes how events are received. In a stressed market, a company that misses estimates can fall further than its own news warrants, and a positive surprise may get less credit.
- It affects deal spreads. Merger arbitrage spreads tend to widen when market volatility jumps, as holders with leverage reduce positions. The deal's own odds may not have changed.
A practical routine is to note the VIX level when you price a stock's event, then compare the stock's implied move for the event expiration with the move in later expirations. The difference isolates the event premium from the market-wide level.
| Reading | What it tells you about a stock event |
|---|---|
| VIX low, stock's event IV high | The event premium is specific to the company |
| VIX high, stock's event IV high | Part of the premium is market-wide and may fade without the event |
| VIX rising into the event | Option prices may rise for reasons unrelated to the company |
| VIX falling after the event | Some of the IV drop is market-wide, not only IV crush |
Where this goes wrong
Treating a low VIX as safety. A low reading means protection is cheap. It is not a forecast that nothing will happen, and some of the sharpest spikes started from low levels.
Treating a high VIX as a signal to act. High readings have tended to fall back over time, but the path can include further spikes. Mean reversion does not tell you when.
Using the VIX for a stock event. Pricing a single-stock catalyst off the VIX understates the move in most cases. Use the stock's own option chain; our guide on estimating an earnings move from options shows how.
Confusing products with the index. VIX futures and ETPs carry their own term structure and roll costs, and they settle on specific dates. Read the product's prospectus before relying on it to track the index.
The bottom line
The VIX is the options market's 30-day estimate of S&P 500 volatility, built from a wide range of SPX option prices and quoted as an annual percentage. Dividing by about 3.46 gives a rough monthly move, and it usually rises as stocks fall. It says nothing about direction and little about single-stock events, which are priced in each company's own options. For the moves behind today's volatility readings, see the market coverage.