

Gamma in one paragraph
Gamma is the rate at which an option's delta changes as the underlying price moves. Delta tells you how much an option's price moves for a $1 move in the stock; gamma tells you how much delta itself changes. Gamma is highest for options near the money and close to expiry. The option Greeks covers delta and gamma in more detail.
Why dealer hedging matters
Market makers who sell options to customers usually hedge their delta by trading the underlying. As the price moves, gamma changes their delta, so they have to adjust the hedge.
- When dealers are long gamma (they own options on net), a rise in the stock makes them longer delta, so they sell stock to rebalance. A fall makes them shorter delta, so they buy. Their hedging leans against the move.
- When dealers are short gamma (they have sold options on net), a rise makes them shorter delta, so they buy stock. A fall makes them longer delta, so they sell. Their hedging adds to the move.
GEX tries to add up this effect across every strike and expiry to estimate how much hedging a given price move would trigger.
How GEX is calculated
For each option series, a typical calculation is:
GEX = Gamma × Open interest × 100 × Underlying price × Sign
Some providers also multiply by the underlying price a second time and by 1% to express the result as dollars of stock traded per 1% move. The sign comes from an assumption about dealer positioning. A common convention assumes customers mostly sell calls, for example as covered calls, and buy puts for protection, so dealers are long call gamma and short put gamma. Other models use trade-level data to estimate who opened each position.
Summing across all strikes gives total GEX. Plotting GEX by strike shows where dealer gamma is concentrated. The price where estimated total GEX crosses zero is often called the gamma flip.
Quick reference
| Term | Meaning | Common reading | Main caveat |
|---|---|---|---|
| Positive GEX | Dealers estimated long gamma | Hedging may dampen moves | Depends on the sign assumption |
| Negative GEX | Dealers estimated short gamma | Hedging may amplify moves | Many other forces drive volatility |
| GEX by strike | Gamma concentration at each strike | Large strikes may act as zones of support or resistance | Open interest changes daily |
| Gamma flip | Price where total GEX changes sign | Hedging behavior may change around it | An approximate zone, not a precise level |
| Call wall, put wall | Strikes with the most call or put gamma | Possible zones where moves slow | Can shift after expiry or new trades |
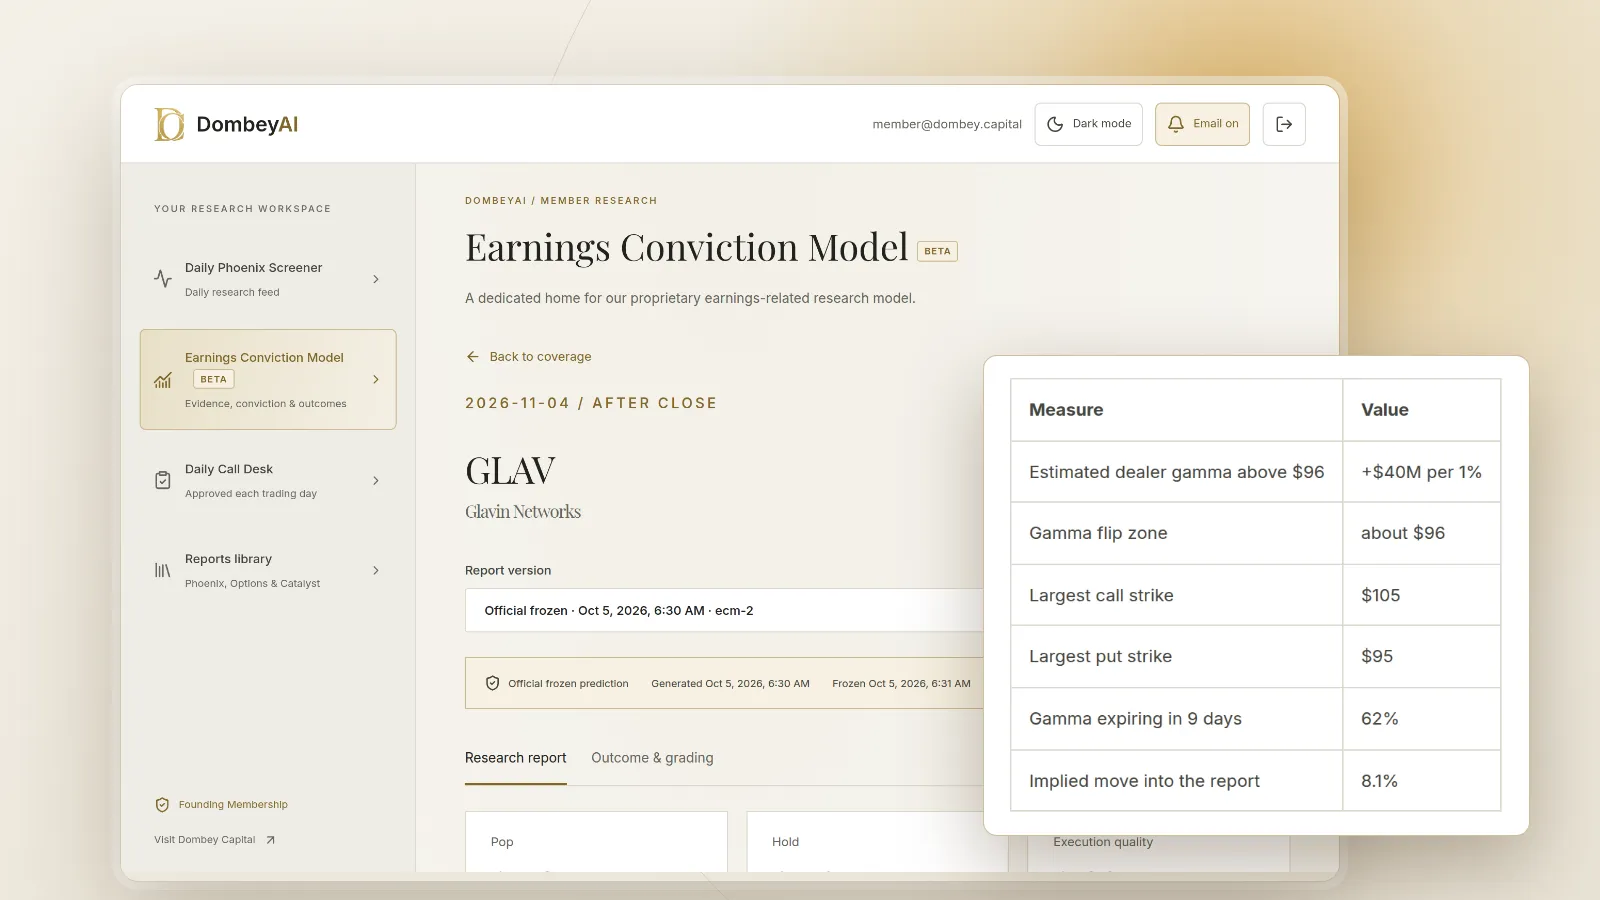
Worked example: reading a GEX profile
A trader might read this as follows: between about $96 and $105, dealer hedging may lean against moves, so the stock could trade in a narrower range than its implied volatility suggests. Below $96, hedging may add to declines. After the nine-day expiry, much of that gamma disappears and the profile changes.
Now add an event. Company A reports earnings in five days. The report can move the stock 8% in a session, and the move will be driven by the results and guidance, not by hedging flows. The GEX profile says little about which way the stock goes after the report. At most, it suggests how hedging might affect the path within the day.
What GEX can tell you
- Broad positioning. Where options open interest, and therefore potential hedging, is concentrated.
- Possible regime. Whether estimated dealer gamma is positive or negative, which some traders associate with quieter or more volatile trading in indexes.
- Expiry effects. How much gamma will roll off at a given expiry, which can change behavior around large monthly or quarterly expirations.
- Context for pinning. Why a heavily traded stock sometimes trades close to a large strike into expiry, a topic related to max pain.
What GEX cannot tell you
- Who holds the options. Open interest counts contracts; it does not show whether dealers are long or short them. Every GEX figure carries an assumption here.
- Intraday positioning. Open interest updates once a day. Positions opened and closed within the day, including many very short-dated options, do not appear.
- How dealers actually hedge. Dealers may hedge with futures, other options or offsetting books, or tolerate some delta.
- Direction after news. For single stocks around earnings, an FDA decision or a deal announcement, the information in the event dominates hedging flows.
- A reliable price target. A large strike can act as a zone of interest, but nothing forces the price to stop there.
How to use GEX alongside other data
- Start with open interest. Look at open interest by strike yourself before using a model's summary.
- Check the expiry mix. Gamma concentrated in options expiring this week matters less after this week.
- Compare with implied volatility. If implied volatility is low and GEX is positive, the market is pricing calm; ask what could change that.
- Overlay the event calendar. An earnings date or a court ruling inside the window can overwhelm any hedging effect.
- Check liquidity. In thinly traded options, small trades change open interest and the GEX profile a lot. Options liquidity covers this.
- Read the method. Find out which sign convention and scaling a provider uses before comparing figures across sources.
Tools that publish GEX and flow data are compared in the 8 best options flow and unusual activity tools.
Where this goes wrong
Treating an estimate as a fact. The sign of dealer gamma is assumed, not observed. When the assumption is wrong, the reading is wrong in direction.
Using index logic on single stocks. The dampening and amplifying story is told mainly about index options, where dealer flows are large relative to the market. For a mid-cap stock, fundamental news and ordinary buying and selling usually matter more.
Ignoring short-dated options. A large share of options volume now expires within days. Daily open interest misses much of it.
Confusing gamma with a squeeze. A rise in a heavily shorted stock with large call open interest can involve both short covering and dealer hedging. GEX alone cannot separate them.
Building trades on the gamma flip. The flip level moves with price, time and open interest. Using it as an exact line invites false precision.
The bottom line
Gamma exposure estimates how much options dealers may need to hedge as a price moves, using open interest, each option's gamma and an assumption about which side dealers hold. Positive estimated dealer gamma is associated with damped moves and negative with amplified moves, mainly in indexes and very liquid stocks. The measure cannot see who actually holds the options, misses intraday positions and says little about direction after news. Use it as context on positioning next to open interest, implied volatility and the event calendar. Dombey's published research weighs options positioning against the dated event before each catalyst; see the research archive. For current situations, see the market coverage.