

The idea behind the model
An investor who buys a share and holds it forever receives only one thing from the company: dividends. Even an investor who sells later receives a price that reflects the dividends the next holder expects. So the value of a share today is the present value of the dividends it will ever pay.
Written out, that is:
P = D1 / (1 + r) + D2 / (1 + r)² + D3 / (1 + r)³ + ...
Where D1, D2 and so on are the dividends expected in each future year and r is the required return. The rest of the DDM family is ways of simplifying that endless sum.
The Gordon growth model
If dividends grow at a constant rate g forever, and r is greater than g, the endless sum collapses to a short formula:
P = D1 / (r - g)
| Input | What it is | Where it comes from |
|---|---|---|
| D1 | Dividend expected over the next 12 months | Current annual dividend times (1 + g), or company guidance |
| r | Required rate of return on equity | Cost of equity estimate or your own hurdle rate |
| g | Constant long-run dividend growth rate | Sustainable growth (ROE times retention), history, economic growth |
| r - g | The spread that drives the value | Must be positive and should not be tiny |
The same formula can be turned around. If Company A trades at $41.20 and pays $2.06 next year, the implied return is the dividend yield plus growth: 5% plus 3%, or 8%. That reversal works like a reverse DCF: instead of asking what a stock is worth, you ask what the price assumes.
Why the model is so sensitive
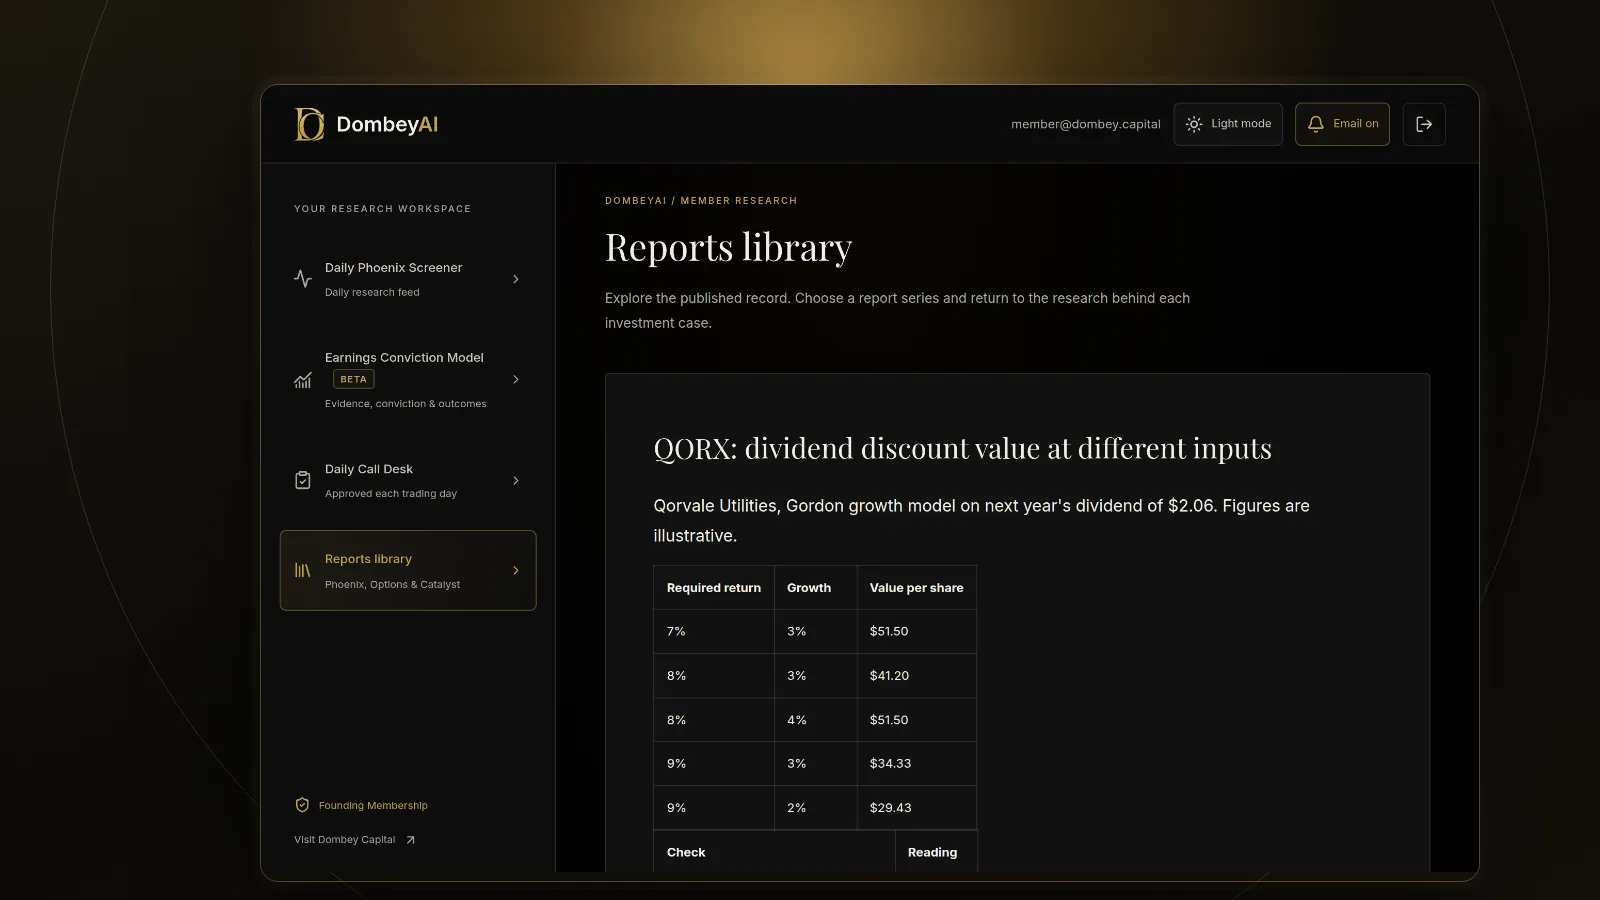
The denominator, r minus g, is usually small, so small changes in either input have large effects.
| Required return (r) | Growth (g) | r - g | Value with D1 = $2.06 |
|---|---|---|---|
| 8% | 3% | 5% | $41.20 |
| 8% | 4% | 4% | $51.50 |
| 9% | 3% | 6% | $34.33 |
| 7% | 4% | 3% | $68.67 |
| 8% | 2% | 6% | $34.33 |
A one-point change in growth moves the value by 25%. Lowering r and raising g by one point each lifts it by two-thirds. This is why careful users test a range of inputs and treat the result as a band, not a point.
The same sensitivity shows up in the terminal value of a full discounted cash flow model, which uses the same perpetuity formula.
Estimating growth and the required return
Growth. A common anchor is sustainable growth: return on equity times the retention ratio. A company that earns a 12% return on equity and keeps 40% of earnings can grow its dividend about 4.8% a year without new capital. For a growth rate assumed to last forever, it should not exceed the long-run growth rate of the economy.
Required return. This is the cost of equity, the return investors need for the risk of the shares. It is the equity part of WACC, often estimated with CAPM or by comparison with similar investments. Many investors simply use a personal hurdle rate.
Multi-stage models
Few companies grow at one steady rate. A multi-stage DDM lets dividends grow faster for a period before settling into a stable rate.
The H-model is a shortcut for growth that fades in a straight line from a high rate to a stable rate. It is less precise but quick for screening.
How the DDM compares with other methods
The DDM is one of several ways to value a share, and each looks at a different cash stream.
| Method | Cash it discounts or compares | Best for | Main weakness |
|---|---|---|---|
| Dividend discount model | Dividends paid to shareholders | Mature, steady payers | Ignores cash retained or used for buybacks |
| Discounted cash flow | Free cash flow of the business | Most operating companies | Many inputs, sensitive terminal value |
| Residual income | Book value plus earnings above the cost of equity | Banks and insurers | Depends on accounting book value |
| Multiples | Price against earnings, book or sales of peers | Quick comparison | Assumes peers are fairly priced |
For a company that pays out most of its free cash flow, a DDM and a DCF should land close together. When they do not, the gap usually comes from the payout ratio: a company keeping cash it does not need will look cheaper on a DCF than on a DDM, and the question becomes whether that cash will ever reach shareholders.
Where the DDM works best
- If a company pays out most of its earnings and grows slowly, such as many utilities, the model fits well.
- If the business is a bank or insurer, where free cash flow is hard to define, dividends and book value are often the clearest anchors. Our guide on how to value a bank stock shows how the two fit together.
- If a company has a long record of stable dividend growth, the history gives a sensible starting point for g.
- If a company pays little and reinvests heavily, use a discounted cash flow model instead.
- If a company returns cash mainly through buybacks, use a total shareholder yield (dividends plus net buybacks) or a free cash flow model.
Where this goes wrong
- Using g close to r. As g approaches r, the value heads to infinity. If the result looks too good, the spread is probably too thin.
- Assuming the dividend is safe. The model takes the dividend as given. A payout ratio above 100%, rising debt or falling earnings can force a cut, and dividend cuts reset the whole valuation.
- Ignoring buybacks. A company that shifts from dividends to buybacks looks less valuable in a DDM even if shareholders receive the same cash.
- Mixing nominal and real figures. If r includes inflation, g must too.
- Using D0 instead of D1. The formula needs next year's dividend; using last year's understates the value.
- False precision. A value to the cent from inputs you cannot know to the percent is not a real estimate.
Dombey's research uses dividends as one anchor among several when valuing steady payers; see the research archive. For tools that run these models, see the best stock research tools for individual investors.
The bottom line
A dividend discount model values a share as the present value of its future dividends, and the Gordon growth formula, P = D1 / (r - g), is its simplest form. It suits mature, steady payers and businesses like banks where dividends are the clearest cash return. Its weakness is sensitivity: the gap between required return and growth drives the answer, so test a range. Use it to ask what a price assumes as often as to estimate what a stock is worth.