

How Tobin's Q is calculated
The textbook formula is simple:
Tobin's Q = market value of the firm ÷ replacement cost of its assets
The market value is the market capitalization of the common stock plus the value of debt and preferred stock. Replacement cost is what it would cost today to buy or build the same productive assets: the plants, ships, wells, stores and inventory.
The problem is the denominator. Companies do not report replacement cost, so analysts use approximations. The table shows the common versions.
| Version | Numerator | Denominator | When it fits |
|---|---|---|---|
| Theoretical Q | Market value of equity, debt and preferred | Replacement cost of assets | Where an appraisal or industry cost data exists |
| Approximate Q | Market value of equity plus book value of debt and preferred | Total assets at book value | Quick screens across many companies |
| Equity Q | Market value of equity | Net worth at replacement cost | Aggregate market studies using Federal Reserve data |
| Asset-specific Q | Enterprise value | Cost per unit of capacity times units | Fleets, mines, towers, hotels, refineries |
The approximate version is the one most screens use. It is easy to compute from a 10-K, but it inherits every distortion in historical-cost accounting.
What a Q above or below 1 means
Tobin's argument was about incentives. If the market values a company's assets above what they cost to build, managers can create value by building more: issue stock or borrow, buy the assets, and the market will pay more than the cost. If the market values the assets below their cost, new investment destroys value and the better use of cash is to buy back stock or buy rivals.
- If Q is well above 1, the market expects the assets to earn more than the cost of capital, and that excess return tends to attract competitors and new capacity.
- If Q is close to 1, the market treats the assets as earning roughly their cost of capital.
- If Q is well below 1, either the assets earn less than the cost of capital, or the market has mispriced them, or both.
That link to returns is why Q and return on invested capital tend to move together. A company earning 15% on capital in a business that costs 9% to fund should trade above its replacement cost.
Replacement cost vs book value vs liquidation value
Three asset values are easy to confuse, and they answer different questions.
- Book value is historical cost less depreciation. A refinery built in 1995 sits on the books at a fraction of what a new one would cost.
- Replacement cost is what it would take to recreate the same capacity today. It is the right yardstick for whether a competitor would build.
- Liquidation value is what the assets would fetch in a sale, often well below replacement cost because buyers know the seller has to sell.
Our explainer on liquidation value vs book value covers the gap between the last two. For Q, the key point is that replacement cost is a ceiling on what a rational buyer would pay for the assets, since above it they would build instead.
A worked example
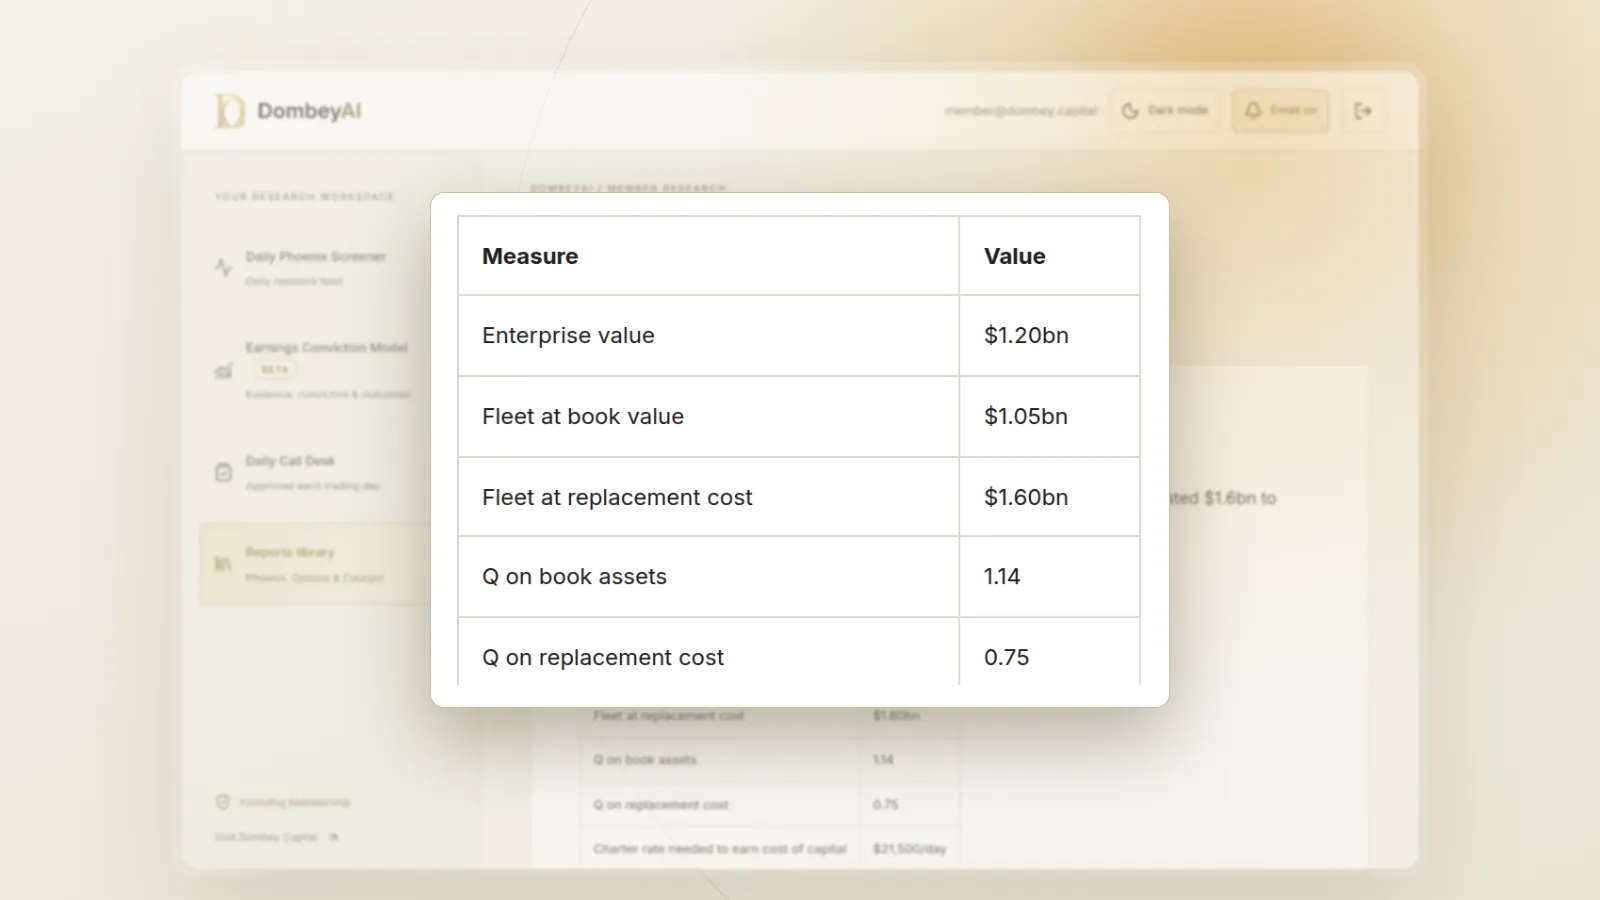
On the approximate method, Q is $1.2bn ÷ $1.05bn, about 1.14, and the stock looks fully priced. On replacement cost, Q is $1.2bn ÷ $1.6bn, or 0.75: the market values each vessel at three quarters of what it would cost to replicate. The difference comes entirely from the denominator.
The low Q is a question. Charter rates may be too low to earn a return on new vessels, in which case nobody will build and the discount may persist until rates rise. If rates recover, the gap tends to close as earnings rise and asset values follow. That is why Q is often read together with the enterprise value per unit of capacity that asset-heavy industries quote.
Where Q is useful for single stocks
Q works best where replacement cost can be estimated from outside data:
- Shipping and offshore, where newbuild prices and secondhand vessel values are quoted.
- Energy and mining, where analysts use cost per barrel of reserves or per ton of capacity.
- Real estate, where construction cost per square foot and land values are available. Our guide on how to value a REIT uses the same logic with net asset value.
- Manufacturing and infrastructure, where cost per unit of capacity is well understood.
It works poorly for software, consumer brands, drug developers and financial services. Their main assets are code, customer relationships, trademarks and staff, which are expensed rather than capitalized. Q will look very high for a fairly priced software company, and the reading tells you little.
Q for the whole market
Economists also compute Q for the US corporate sector. The Federal Reserve's Financial Accounts of the United States, release Z.1, estimate both the market value of nonfinancial corporate equity and corporate net worth with assets at current cost. Dividing one by the other gives an equity Q for the market as a whole.
Andrew Smithers and Stephen Wright used this ratio in their book Valuing Wall Street to argue that the market was overvalued in 2000. Since then the aggregate figure has spent long periods well above its historical average while stocks kept rising. That record suggests aggregate Q says more about long-run returns than about the next year.
Where this goes wrong
- The denominator is an estimate. Replacement cost depends on assumptions about technology, location and age. Two analysts can produce estimates 30% apart for the same plant.
- Obsolete assets still have a replacement cost. A coal plant or a fleet of old vessels may cost a lot to rebuild, yet nobody would rebuild them. Q below 1 is right for assets the world no longer wants.
- Intangibles are missing. For most modern companies, book assets miss much of the value, so Q runs high. Goodwill on the balance sheet adds the opposite error; our explainer on goodwill and impairments shows why.
- Low Q can last. Without a catalyst such as a sale, a buyback, a cycle turn or an activist, a discount to replacement cost can persist for years.
For tools that put balance sheet data and asset values side by side, see our list of the best stock research tools for individual investors. Dombey's published research weighs asset value against what a business can earn before each catalyst; see the research archive.
The bottom line
Tobin's Q compares what the market pays for a company with what it would cost to rebuild its assets. Above 1 it implies returns above the cost of capital; below 1 it implies the assets earn too little or are mispriced. The ratio is only as good as its replacement cost estimate, so it is most useful in asset-heavy industries where that cost can be checked against outside data. Read a low Q as a question about returns and catalysts, not as a finished case.