

Why an earnings manipulation score matters
Most valuation work starts from reported earnings. A price-to-earnings ratio, an earnings yield or a discounted cash flow model is only as good as the profit figure underneath it. If revenue is pulled forward or costs are pushed into the balance sheet, a stock can look cheap when it is not.
Manipulation also tends to end in a special situation of its own: a financial restatement, an auditor resignation, a material weakness disclosure or a short seller report. The M-Score is one way to spot the conditions for those events before they arrive.
The eight variables
Each variable compares the latest year with the year before. A value of 1.0 means nothing changed; values above 1.0 usually point toward higher manipulation risk.
| Variable | Name | What it measures | Why it matters |
|---|---|---|---|
| DSRI | Days sales in receivables index | Receivables relative to sales, this year vs last | Receivables growing faster than sales can mean revenue booked before cash is collected |
| GMI | Gross margin index | Last year's gross margin divided by this year's | Falling margins create pressure to manage earnings |
| AQI | Asset quality index | Share of assets that are not current assets or property, plant and equipment | Rising soft assets can mean costs being capitalized |
| SGI | Sales growth index | Sales this year divided by sales last year | Fast growth raises pressure to keep the pace up |
| DEPI | Depreciation index | Last year's depreciation rate divided by this year's | Slower depreciation lifts earnings without any change in the business |
| SGAI | SG&A index | SG&A relative to sales, this year vs last | Rising overhead relative to sales is a sign of weaker economics |
| LVGI | Leverage index | Total debt relative to total assets, this year vs last | Rising leverage brings debt covenants into play |
| TATA | Total accruals to total assets | Income from continuing operations minus cash from operations, divided by total assets | Earnings not backed by cash are the single strongest signal in the model |
The formula
The eight-variable version of the model is:
M = -4.84 + 0.920 x DSRI + 0.528 x GMI + 0.404 x AQI + 0.892 x SGI + 0.115 x DEPI - 0.172 x SGAI + 4.679 x TATA - 0.327 x LVGI
The weights tell you which signals carry the most information. Accruals (TATA) has by far the largest coefficient, followed by receivables (DSRI) and sales growth (SGI). The SG&A and leverage terms carry negative coefficients in the estimated model, so they pull the score down slightly as they rise.
The thresholds
The 1999 paper used a cutoff of -1.78. A company scoring above -1.78 is classified as a likely manipulator. Many later screens and textbooks use -2.22, a lower cutoff that flags more companies and catches more manipulators at the cost of more false alarms. Pick one and apply it consistently; the choice matters less than reading the filings behind any company that scores high.
A worked example
| Input | Last year | This year |
|---|---|---|
| Sales | $500m | $600m |
| Receivables | $60m | $102m |
| Gross margin | 30% | 27% |
| Income from continuing operations | $40m | $55m |
| Cash from operations | $42m | $15m |
| Total assets | $700m | $800m |
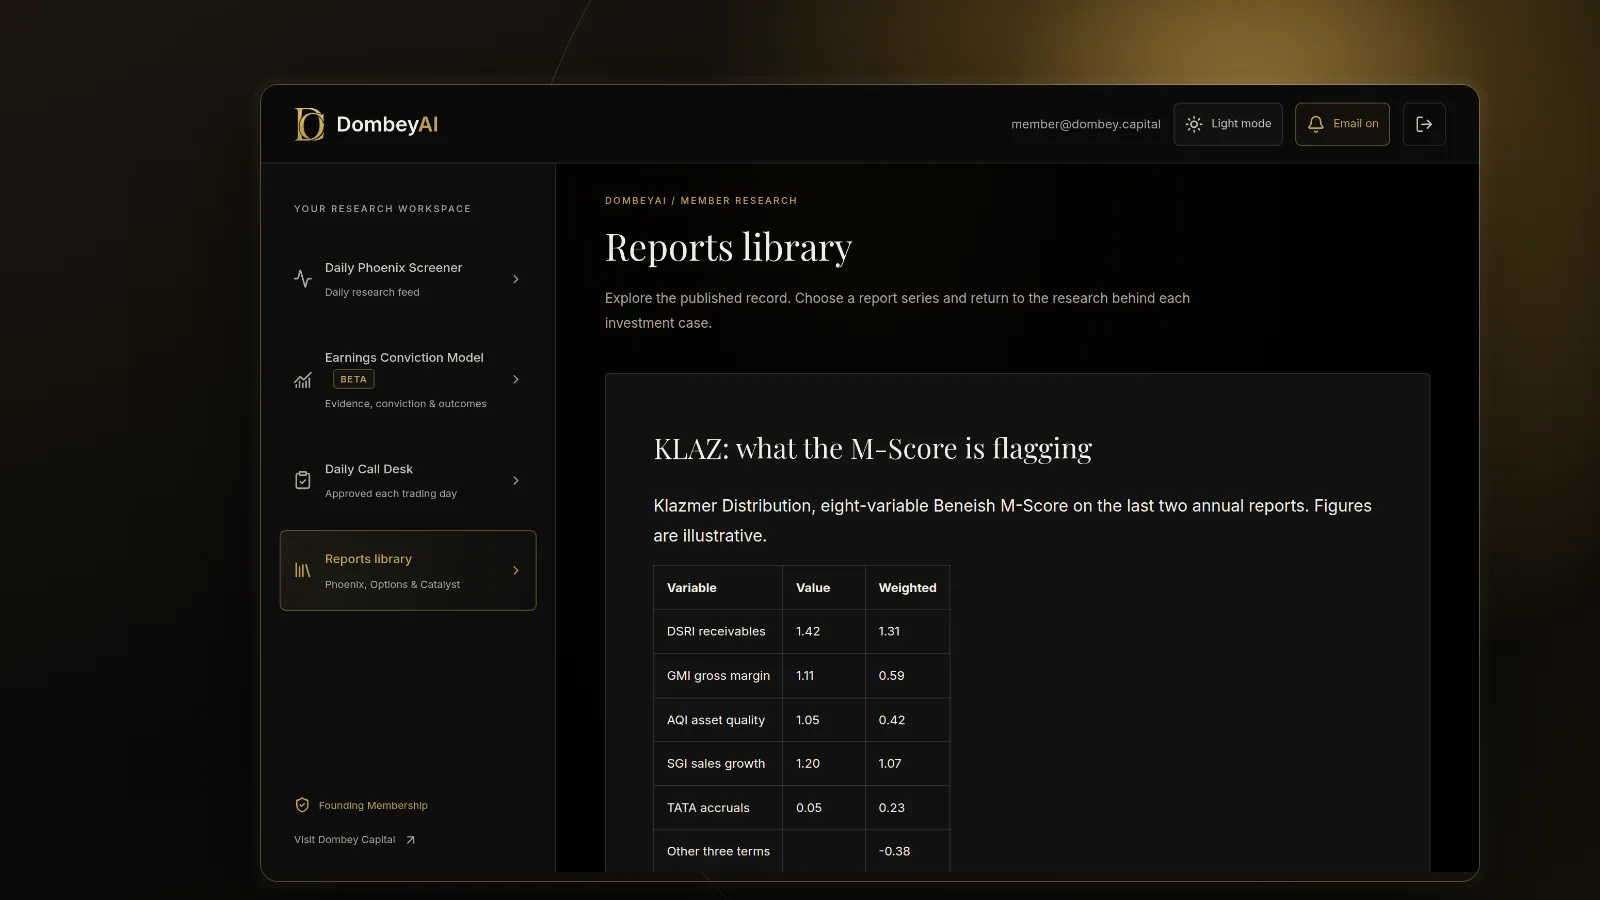
Receivables rose from 12% of sales to 17% of sales, so DSRI is 17 / 12 = 1.42. Margins fell from 30% to 27%, so GMI is 30 / 27 = 1.11. Sales grew 20%, so SGI is 1.20. Accruals are $55m of income minus $15m of cash, or $40m, which is 5.0% of total assets, so TATA is 0.05.
Assume the other four indexes are close to 1.0: AQI 1.05, DEPI 1.02, SGAI 0.98 and LVGI 1.00. The score is:
-4.84 + 0.920(1.42) + 0.528(1.11) + 0.404(1.05) + 0.892(1.20) + 0.115(1.02) - 0.172(0.98) + 4.679(0.05) - 0.327(1.00) = about -1.60
That is above both -1.78 and -2.22, so Company A screens as a possible manipulator. The drivers are clear: receivables jumped, cash flow fell well short of earnings, and margins weakened while sales grew fast. None of that proves anything, but it tells you exactly which footnotes to open.
How to use the score in research
Treat the M-Score as a filter that sends you to specific pages of the 10-K.
- If DSRI is high, read the revenue recognition policy and the receivables footnote. Look for longer payment terms, bill-and-hold sales or a jump in unbilled receivables.
- If TATA is high, compare net income with cash from operations line by line in the cash flow statement. Working capital swings and non-cash gains explain most gaps.
- If AQI is high, check what was capitalized: software development, contract costs or deferred charges.
- If DEPI is high, look for a change in useful lives or salvage values in the accounting policy note.
- If the score is high and the auditor has changed, treat the case as serious.
Our step-by-step guide to reading the footnotes in a 10-K covers where each of these disclosures sits. The M-Score sits alongside other accounting screens: the Piotroski F-Score measures the strength of a company's fundamentals, and the Altman Z-Score measures distress risk.
Where this goes wrong
The model was estimated on a sample of manipulators from the 1980s and early 1990s, and it has known blind spots.
- Growth looks like manipulation. A fast-growing company naturally has rising receivables and high sales growth. The model cannot tell honest growth from stuffed channels.
- Acquisitions distort every ratio. Buying a company adds receivables, goodwill and debt in one step, which pushes up DSRI, AQI and LVGI without any change in accounting quality.
- It ignores the industry. Banks, insurers and many asset-light companies do not fit the ratios. Results for them are close to meaningless.
- It misses some schemes. Fraud that inflates cash, such as fictitious bank balances, or that hides liabilities off the balance sheet can leave the eight ratios looking normal.
- False positives are common. Most companies that score above the cutoff are not manipulating earnings. Shorting or avoiding a stock on the score alone would mean acting on many false alarms.
M-Score vs other forensic screens
| Screen | Question it answers | Main inputs | Best use |
|---|---|---|---|
| Beneish M-Score | Is reported profit likely overstated? | Eight year-over-year ratios, accruals | Before trusting earnings in a valuation |
| Altman Z-Score | Is the company at risk of distress? | Working capital, retained earnings, EBIT, market value, sales | Before owning a leveraged or shrinking company |
| Piotroski F-Score | Are fundamentals improving? | Nine binary tests on profit, leverage and efficiency | Sorting cheap stocks into improving and deteriorating |
| Accruals ratio | How much of profit is not cash? | Net income, cash from operations, assets | Quick check on earnings quality |
Investors who want a broader set of screening tools can compare options in our guide to the best stock research tools for individual investors. Dombey's published research reads the cash flow statement and the footnotes before each catalyst call; see the research archive.
The bottom line
The Beneish M-Score turns eight ratios into a single estimate of whether a company's earnings may be overstated. It weights accruals, receivables and sales growth most heavily, and a score above -1.78, or -2.22 in stricter use, marks a company for a closer look. It is a screen with many false positives, especially in growing and acquisitive companies, so its value is in pointing you to the specific footnotes and cash flow lines that explain the gap between profit and cash.