

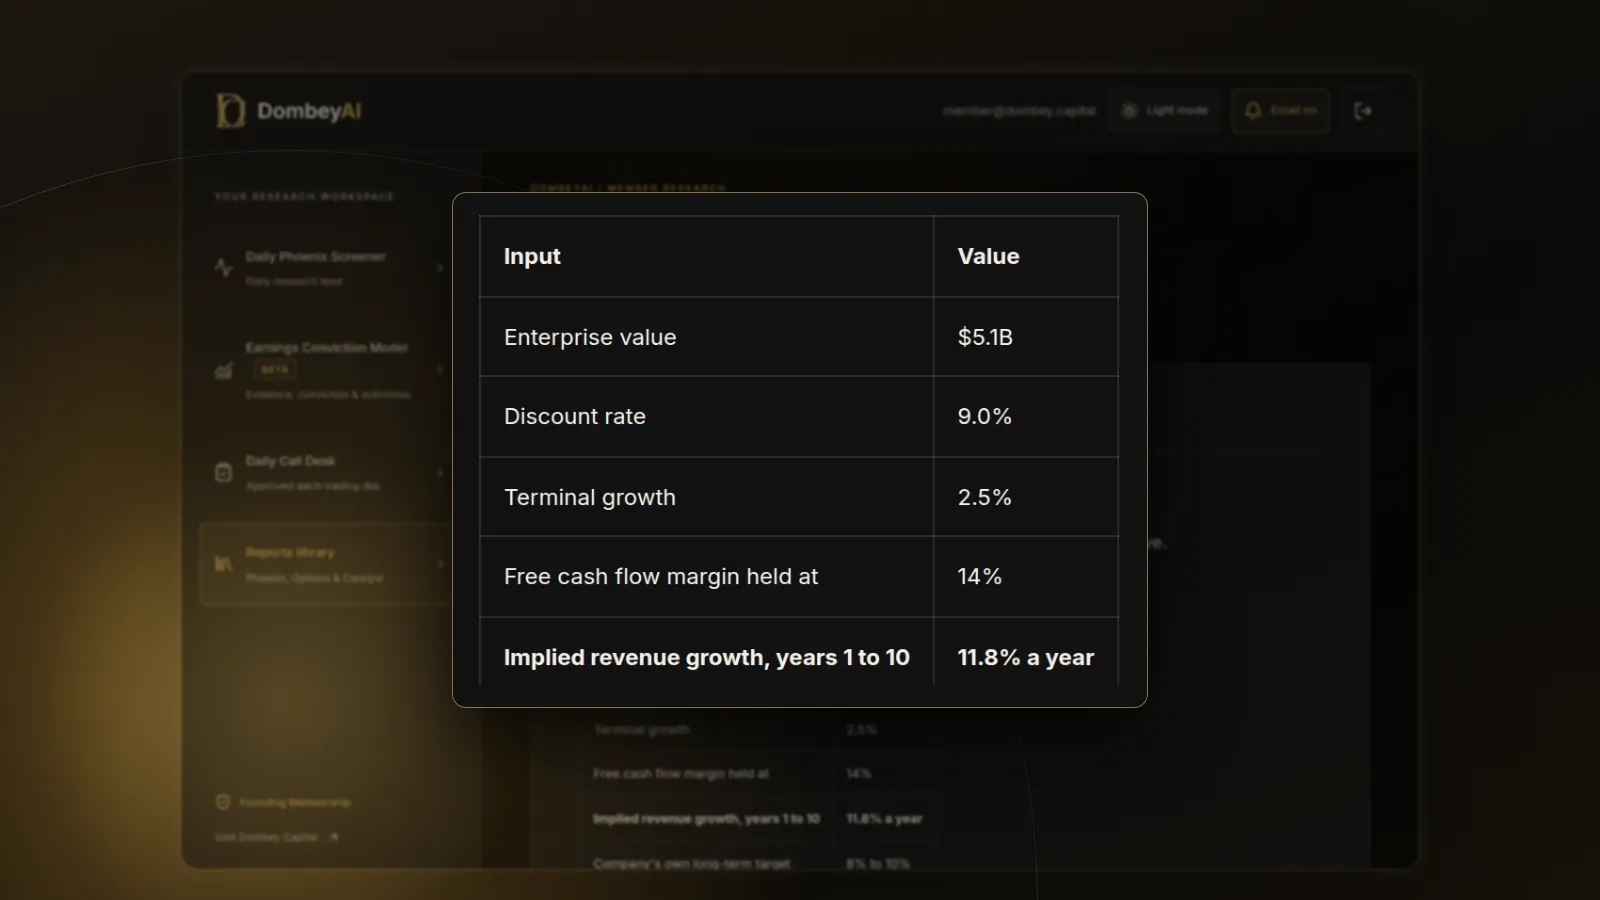
How a reverse DCF differs from a forward DCF
A forward discounted cash flow (DCF) has one unknown, value. You supply the forecast, the discount rate and the terminal value, and the model tells you what the business is worth. The weak point is the forecast. Small changes in growth or margins move the answer a lot, and it is easy to build a model that confirms what you already believed.
A reverse DCF keeps the same formula and moves the unknown. Price becomes an input. Growth, margin or duration becomes the output. You stop asking "what is this worth?" and start asking "what does this price assume?"
That shift matters for two reasons. First, the market price is the one number in the model that is not an estimate. Second, it is usually easier to judge whether an assumption is reasonable than to produce one from scratch. Most investors cannot say with confidence whether a company will grow cash flow at 11% or 14%. Many can say that 25% a year for a decade would be unusual for a mature industrial business.
What you can solve for
Any single input in a DCF can be the unknown. Three are common.
| Solve for | Hold fixed | Question it answers | Best suited to |
|---|---|---|---|
| Free cash flow growth rate | Discount rate, forecast length, terminal growth | How fast must cash flow grow? | Most businesses with positive cash flow |
| Free cash flow or operating margin | Revenue path, discount rate, terminal growth | How profitable must the business become? | Companies with a clear revenue outlook and margin debate |
| Years of above-average growth | Growth rate, discount rate, terminal growth | How long must growth last? | Steady compounders with a known growth rate |
| Discount rate (implied return) | Your own cash flow forecast | What return does today's price offer on my forecast? | Comparing stocks against a required return |
The last row is a variant. If you hold your own forecast fixed and solve for the discount rate, the output is the annual return the price implies on your assumptions. That is a forward DCF in disguise, since it still depends on your forecast, but it is useful for ranking ideas against a hurdle rate.
How to run one, step by step
- Start from enterprise value, not market cap. Take the share price times the diluted share count, add debt, preferred stock and minority interest, and subtract cash. Our explainer on enterprise value covers each item. If you discount unlevered cash flow, this is the target the model must match.
- Pick a starting cash flow. Use trailing unlevered free cash flow, normalized for one-off items. Our guide to reading a cash flow statement shows where each line comes from.
- Set the fixed inputs. Choose a discount rate, usually the weighted average cost of capital (WACC), a terminal growth rate of around 2% to 3%, and a forecast length of five or ten years.
- Solve. Change the unknown until the present value of the cash flows plus the terminal value equals the enterprise value. A spreadsheet goal-seek does this in one step.
- Repeat at other settings. Re-solve at a discount rate one point higher and lower, and at a different terminal growth rate. The range matters more than any single answer.
- Compare the result with evidence. Check the implied figure against the company's own history, its peers and its reinvestment needs.
A worked example
Step one: the no-growth value
Start by asking what the business is worth if free cash flow never grows during the forecast and then grows at the terminal rate. At 9% and 2.5%, that gives an enterprise value of about $2,121 million. Subtract the $500 million of net debt and equity is worth about $1,621 million, or roughly $16.20 a share.
The stock trades at $40. About $23.80 a share, nearly 60% of the price, is a payment for growth that has not happened yet. That split alone is useful. It shows how much of the price rests on the future rather than on the business as it stands today.
Step two: the implied growth rate
Now solve for the constant annual growth rate in years one to five that makes the model equal $4,500 million. The answer is about 18.1%. Free cash flow would have to rise from $150 million to about $345 million by year five, more than doubling, and then grow at 2.5% a year after that.
Stretching the forecast to ten years lowers the required rate to about 11.0% a year, but asks for that growth to last twice as long. The two answers describe similar total expectations spread over different periods.
Step three: the implied margin
Suppose instead that revenue growth is fairly visible, say 6% a year, taking revenue to about $2,007 million in year five. Hold that path and solve for the constant free cash flow margin across all five years. The answer is about 16.4%, against 10% today. The price assumes either much faster cash flow growth or a large and lasting margin gain. If Company B's best year ever produced a 12% margin and its peers sit near 11%, that is the debate worth having.
Step four: the range
Implied five-year growth rates at different settings, same $40 price:
| Discount rate | Terminal growth 2.0% | Terminal growth 2.5% | Terminal growth 3.0% |
|---|---|---|---|
| 8% | 15.6% | 13.7% | 11.8% |
| 9% | 19.7% | 18.1% | 16.4% |
| 10% | 23.6% | 22.2% | 20.6% |
Across reasonable settings, the price implies roughly 12% to 24% annual growth for five years. Price changes the answer too: at $30 a share the 9% and 2.5% case implies about 11.8%, and at $55 it implies about 25.7%.
How to judge the implied number
The output is only useful once it meets evidence. These checks do most of the work.
- If the implied growth is above the company's own best five-year record, write down what is different now.
- If the implied margin is above every peer's margin, ask what advantage would let this company earn it and keep it.
- If growth requires heavy reinvestment, check the return on that capital. Our explainer on return on invested capital (ROIC) shows why growth at a low return destroys value even when cash flow rises.
- If the implied figure is below the company's recent, durable record, the price may be assuming a slowdown. Look for the reason before treating it as cheap, since our list of value trap warning signs covers the usual ones.
- If the implied figure sits comfortably inside the range of history and peers, the price is not asking for much, and the gap to your own view becomes your margin of safety.
A simple cross-check is the free cash flow yield. In the Company B example, trailing free cash flow of $150 million against a $4,500 million enterprise value is a yield of about 3.3%. With a 9% required return, roughly 5.7 points of the return must come from growth. That matches the reverse DCF's message in a single line.
Where this goes wrong
- A bad starting cash flow. If trailing free cash flow is inflated by a working capital release or depressed by a one-off charge, every implied figure inherits the error. Normalize first.
- Ignoring stock-based compensation. Free cash flow that adds back large share grants overstates the cash available to owners. Either deduct the expense or use a share count that grows.
- Treating the output as a forecast. The implied rate is what the market assumes, not what will happen. A high implied rate can still be beaten, and a low one can still be missed.
- Mismatched cash flow and discount rate. Unlevered cash flow pairs with WACC and enterprise value. Levered cash flow pairs with the cost of equity and market cap. Mixing them distorts the result without any warning.
- Applying it where cash flow is not the driver. Banks, early-stage biotechs and companies priced on a single legal or regulatory outcome do not fit. For a binary event, probability-weighted valuation is a better tool. For a stock priced below its liquidation value, asset values matter more than implied growth.
- Ignoring cyclicality. A cyclical company at peak earnings can show low implied growth that looks cheap. At the trough, the same business can look expensive. Use mid-cycle cash flow.
Reverse DCF in a special situations process
The method is most useful when a catalyst is about to change the cash flows. Before a spin-off, run it on the parent at today's price and again on the expected remaining business. Before a large asset sale or refinancing, check whether the price already assumes the better balance sheet. In each case the question is the same: what is already in the price, and what would change it.
It also pairs well with scenario work. Once you know the price implies 18% growth, you can build a base case and a worst case around that figure and see how far the outcomes fall on either side. Dombey's published research uses the same check to show what a price assumes before each catalyst; see the research archive.
You can build a reverse DCF in any spreadsheet with a goal-seek function. Several data platforms include DCF templates you can run in reverse, and our guide to the best DCF calculators and valuation tools covers which ones let you solve for growth. For historical cash flow and margin data to test the implied figures, our list of stock research tools for individual investors compares the main options.
Verdict: A reverse DCF is the better first step for most stocks. It turns the price into a specific claim about growth or margins, and that claim is easier to test than a forecast you built yourself.
The bottom line
A reverse DCF solves for the growth, margin or duration that today's price implies, using the same formula as a standard DCF with the unknown moved. The no-growth value shows how much of the price rests on the future, and the implied figure states that expectation in plain terms. Run it across a few discount and terminal growth rates, then test the range against history, peers and returns on capital. If the price only works with a figure the company has never reached, the stock needs more to go right than the multiple alone suggests.