

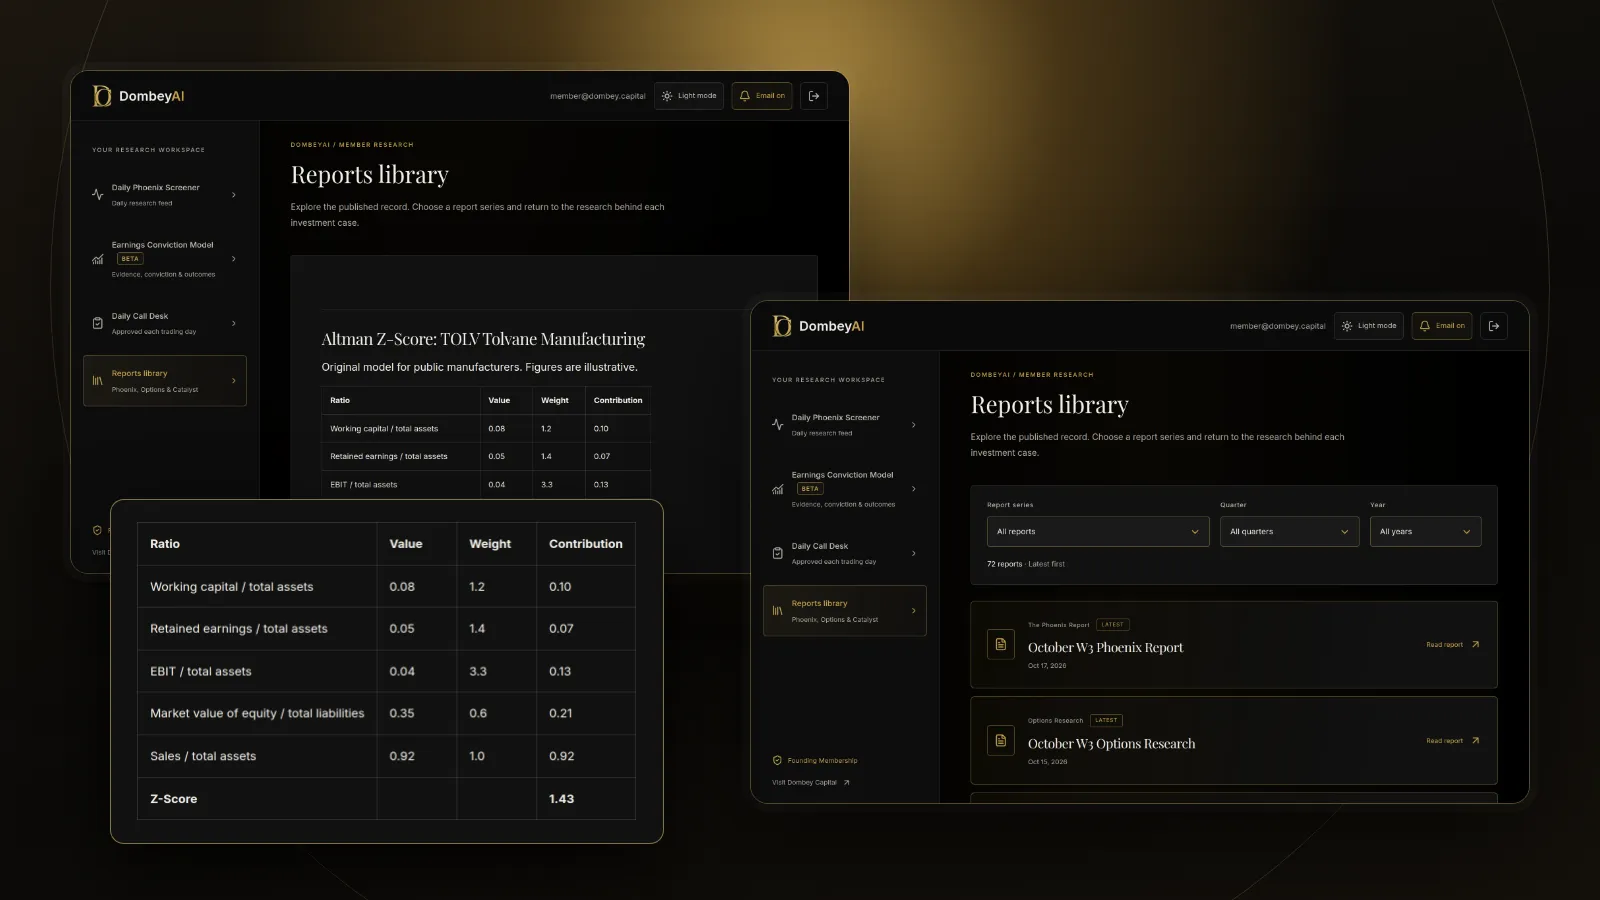
The formula
The original model is:
Z = 1.2X1 + 1.4X2 + 3.3X3 + 0.6X4 + 1.0X5
Each X is a ratio taken from the balance sheet and income statement. Four of them are divided by total assets, which puts companies of different sizes on the same scale.
| Ratio | Calculation | Weight | What it measures |
|---|---|---|---|
| X1 | Working capital / total assets | 1.2 | Short-term liquidity against the size of the business |
| X2 | Retained earnings / total assets | 1.4 | Accumulated profitability and how much of the business was funded by its own earnings |
| X3 | EBIT / total assets | 3.3 | Operating earning power of the assets, before interest and tax |
| X4 | Market value of equity / total liabilities | 0.6 | How far the equity cushion could fall before liabilities exceed assets |
| X5 | Sales / total assets | 1.0 | Asset turnover, how much revenue the assets generate |
In the 1968 paper, X1 through X4 were entered as percentages, so the published weights were 0.012, 0.014, 0.033 and 0.006, with 0.999 on X5. Entering all five ratios as decimals gives the 1.2, 1.4, 3.3, 0.6 and 1.0 version shown above. The two forms give the same answer as long as you stay consistent.
All the inputs except market capitalization come from the latest 10-K or 10-Q. The SEC's beginners' guide to financial statements explains where each one sits: working capital is current assets minus current liabilities, retained earnings is in the equity section, and EBIT is operating income before interest and taxes. Our explainer on working capital for equity investors covers the first ratio in more detail.
The three zones
Altman set two cutoffs. Scores between them are the zone where the model's two groups overlapped and the score gives no clear answer.
| Zone | Original Z (public manufacturers) | Z'' (non-manufacturers) | How to read it |
|---|---|---|---|
| Safe | Above 2.99 | Above 2.60 | Ratios look like those of companies that did not fail |
| Grey | 1.81 to 2.99 | 1.10 to 2.60 | Mixed signals; the score alone does not separate the groups |
| Distress | Below 1.81 | Below 1.10 | Ratios look like those of companies that later failed |
Z'' for companies that are not manufacturers
The original sample was public manufacturers, and X5, sales to total assets, penalizes asset-heavy businesses and flatters retailers and distributors that turn assets over quickly. Altman later published a version, usually written Z'' (Z double prime), for non-manufacturing companies and companies outside the US:
Z'' = 6.56X1 + 3.26X2 + 6.72X3 + 1.05X4
It differs from the original in three ways. It drops X5 altogether. It uses the book value of equity in X4 instead of market value, so it can be run on companies without a share price. It applies new weights and new cutoffs: above 2.60 safe, 1.10 to 2.60 grey, below 1.10 distress. Scores from the two models are not comparable, so a Z'' of 2.0 and an original Z of 2.0 mean different things.
A worked example
A score of 1.90 sits just inside the grey zone. Now suppose the share price falls 40% on an earnings miss and nothing on the balance sheet changes. Market capitalization drops to $180m, X4 falls to 0.30, its weighted term falls to 0.180, and the Z-score becomes 1.78. Company A is now in the distress zone, although its working capital, earnings and debt are exactly what they were the day before.
Run the same company through Z''. Book equity is total assets minus total liabilities, $400m, so X4 is 0.67. The weighted terms are 0.525, 0.489, 0.403 and 0.700, for a Z'' of 2.12. That is in the Z'' grey zone, and it does not move when the share price falls, because Z'' uses book equity.
The example shows the trade-off between the two inputs. Market value reacts quickly to new information, which can be an early warning, but it also imports the market's mood into what looks like an accounting measure.
How to use the score
The Z-score is most useful as a first filter on a list of cheap stocks. Companies that screen as cheap on price to book or on net current asset value are often cheap because the market doubts they will survive. A low score tells you which ones need the most work on the balance sheet before anything else.
- If the score is in the safe zone, the balance sheet is unlikely to be the main question. Move on to earnings quality and valuation, and still check when the debt matures.
- If the score is in the grey zone, look at the trend over the last eight quarters and at which ratio is dragging it down.
- If the score is in the distress zone, read the debt footnote, the liquidity section of the MD&A and the auditor's report for a going-concern warning.
- If the score dropped mainly because of X4, decide whether the share price fall reflects a real change in the business or a reaction you disagree with.
- If the company is a bank, insurer or early-stage business, set the score aside and use measures built for that kind of company.
The trend is often more informative than the level. A company that slid from 3.4 to 2.1 over two years is telling you something, even though 2.1 is not yet in the distress zone. Break the change into its five terms to see whether it came from shrinking margins (X3), losses eating retained earnings (X2), tighter liquidity (X1) or a lower share price (X4).
Most screening sites calculate the score for you. Our comparison of stock research tools for individual investors covers which platforms show it and how they handle the inputs. Recalculate it from the filing whenever the result drives a decision, because sites differ on whether they use trailing twelve-month EBIT, annual figures or the most recent balance sheet.
What the score leaves out
Pros
- Uses only public data from the financial statements and the share price.
- Combines liquidity, profitability, leverage and efficiency into one comparable number.
- Quick to calculate across a whole screen of companies.
- The trend in the five terms shows where stress is building.
Cons
- Ignores when debt comes due, so a company with a large maturity next year can score the same as one with nothing due for a decade.
- Ignores covenants, interest rates and the terms of the credit agreement.
- Uses balance sheet totals that can be distorted by goodwill, write-downs and buybacks.
- Built on a small historical sample of manufacturers, with weights fixed decades ago.
Timing is the biggest gap. Companies rarely file because their ratios are poor; they file because a payment comes due that they cannot meet or refinance. Pair the score with the debt schedule, as described in what a debt maturity wall is, and with cash flow from operations, using our guide on how to read a cash flow statement. Leverage measures like the debt-to-equity ratio add a view of the capital structure the score only touches through X4.
Dombey's published research checks balance sheet stress against the debt schedule before each catalyst; see the research archive.
Where this goes wrong
- Using the wrong model. Running the original Z on a software company, a retailer or a service business mixes it up with a sample it was not built for. Use Z'' for non-manufacturers and do not compare scores across models.
- Applying it to financial companies. Banks and insurers have balance sheets built from deposits and reserves. Their scores are meaningless, which is why bank analysis starts from capital and asset quality, as in our guide on how to value a bank stock.
- Reading the share price as fundamentals. X4 can move a company across a zone line in a single day. Check how much of a change came from the market and how much from the business.
- Mixing dates. Taking the share price from today and the balance sheet from a 10-K that is ten months old gives a score for no real moment in time. Use the latest filing and note the date.
- Trusting negative retained earnings blindly. Large buybacks, special dividends or a past write-down can make retained earnings small or negative at a profitable company, which drags X2 down without signaling distress.
- Treating a low score as a short signal or a cheap stock as safe. A distressed score can coincide with a recovery, and a safe score does not protect against a value trap whose business is shrinking.
- Ignoring what happens after a filing. For shareholders the question is not only whether a company fails but what the equity is worth if it does. Our explainer on what happens to stock in Chapter 11 covers why common shareholders are usually last in line.
The bottom line
The Altman Z-score combines working capital, retained earnings, EBIT, market value of equity and sales, each scaled to the size of the company, into one number that shows how closely a company resembles past bankruptcies. Under the original model, above 2.99 is safe, 1.81 to 2.99 is grey and below 1.81 is distress, and the Z'' variant has its own weights and cutoffs for non-manufacturers. Use the score to decide which companies need a closer look at the balance sheet, then read the debt schedule, the cash flow statement and the going-concern disclosure before drawing a conclusion. It is a starting point for that reading, not a substitute for it.