

The two formulas
Both measures start from the same input: a daily series of implied volatility readings for one stock over a lookback window. Most tools use a 30-day constant-maturity implied volatility, built by blending the expiries on either side of 30 days, and record one value per trading day at the close. The lookback is usually 52 weeks, or about 252 trading days.
IV rank compares today with the extremes of that series:
IV rank = (current IV minus lowest IV in lookback) / (highest IV in lookback minus lowest IV in lookback) x 100
IV percentile compares today with every day in the series:
IV percentile = number of days in lookback with IV below current IV / total days in lookback x 100
The difference matters. IV rank uses only two data points from the past year, the single highest close and the single lowest close. IV percentile uses all of them. A stock that spent eleven calm months near 25% and one week at 90% will show a very different IV rank from its IV percentile, because the 90% week stretches the range that IV rank divides by.
A worked example where they disagree
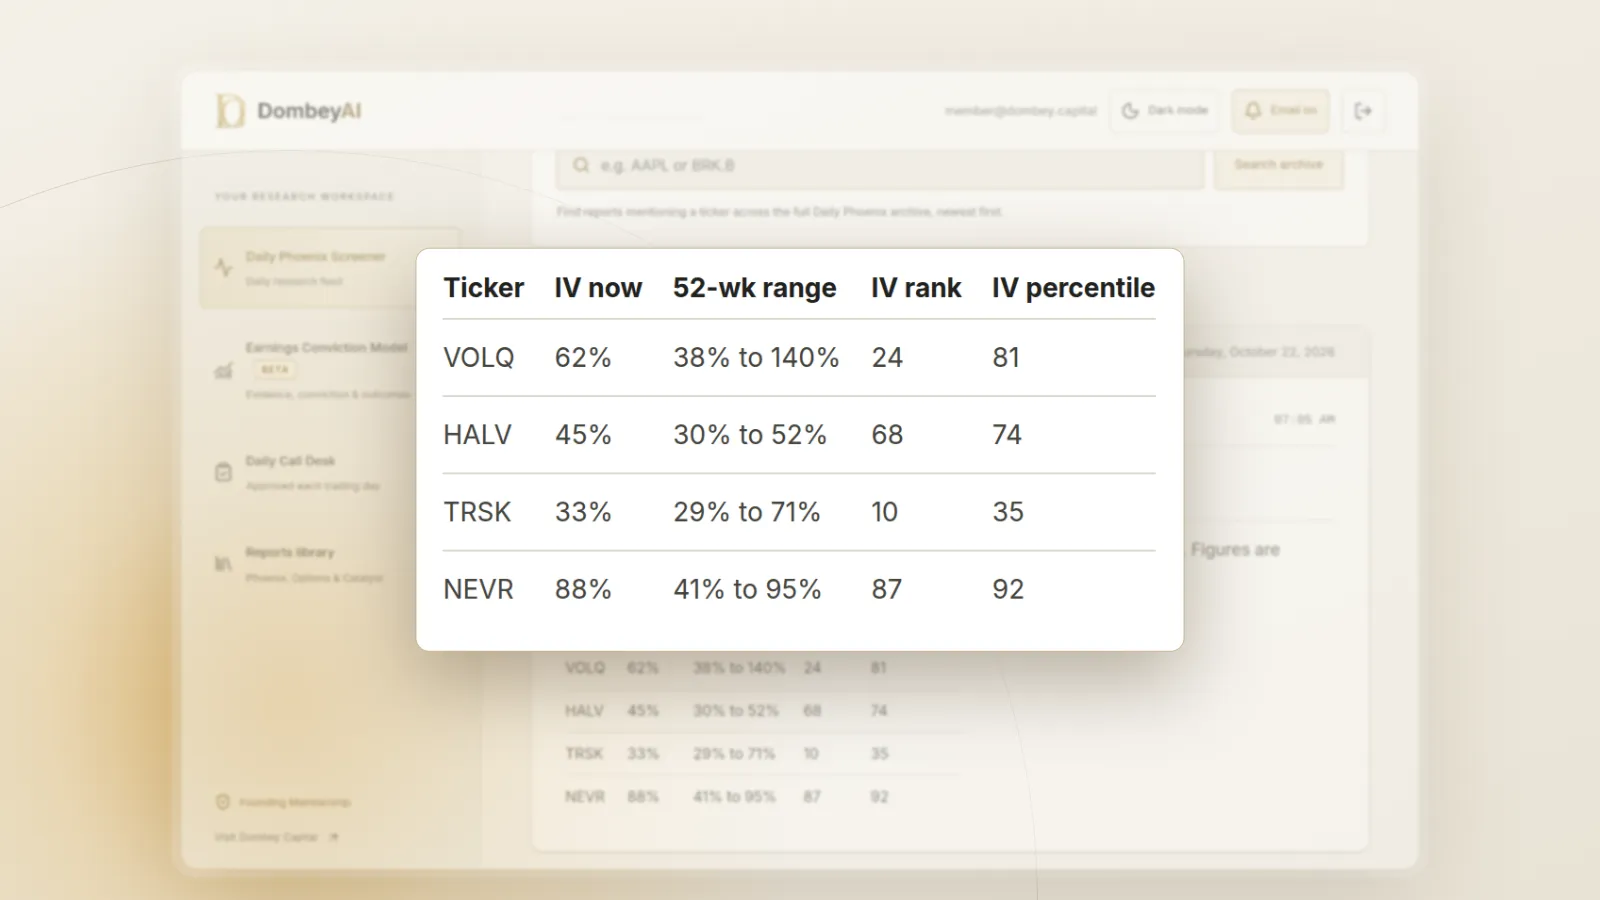
An IV rank of 30 reads as "options are fairly calm." An IV percentile of 83 reads as "options are more expensive today than on most days this year." The second is the more accurate description of Company A. The three-day spike set the top of the range, and every reading since then has been compressed toward the bottom of the IV rank scale.
The opposite pattern also occurs. Suppose a stock spent most of the year with implied volatility near 60%, dipped to 20% for a few quiet sessions, and now sits at 55%. IV rank is (55 minus 20) / (60 minus 20) x 100, or about 88, while IV percentile is low, because most days in the year closed above 55%. When the two numbers are far apart, the lookback contains an outlier, and you should find out what it was before trusting either.
Quick reference: IV rank vs IV percentile
| Question | IV rank | IV percentile |
|---|---|---|
| What it measures | Position between the lookback low and high | Share of lookback days with lower IV |
| Data points used | Two: the highest and lowest close | Every day in the lookback |
| Effect of one spike | Compresses all later readings for the full lookback | Small; one spike is a few days out of 252 |
| Effect of a long calm period | Little, unless it sets a new low | Pulls today's reading up if today is above the calm level |
| Can it read 100? | Only on the day IV sets a new lookback high | Only when today is above every prior day |
| Best used for | How far today sits from the recent extreme | How unusual today's level is |
| Main weakness | Hostage to outliers | Ignores how far above other days today is |
Calculation details that change the number
Two tools can show different readings for the same stock on the same day. The usual causes:
- The implied volatility series. One tool may use 30-day constant-maturity implied volatility, another the at-the-money option in the front expiry, another a weighted blend of strikes. A front-expiry series jumps when an earnings expiry rolls into the front position; a constant-maturity series moves more smoothly.
- The lookback. 52 weeks is common, but some platforms offer 6 months or 2 years. A shorter lookback drops old spikes sooner and reacts faster to new ones.
- Intraday versus close. Some tools update IV rank during the session against a range built from closing values. The live reading can briefly print above 100 or below 0 if today's intraday level breaks the closing range.
- Ties and naming. IV percentile can count days "below" or "at or below" today. A few platforms also label as IV rank what others call IV percentile. Read the tool's definition once and stick with one source.
The comparison of options analysis tools for earnings notes which platforms show IV rank, IV percentile and the underlying series side by side.
Using IV rank and IV percentile around earnings
Earnings are where these measures are most often misread. Options expiring after a report carry the risk of a one-day jump, so implied volatility on those expiries rises in the weeks before the date. Most companies report four times a year, which means a one-year lookback contains four pre-earnings peaks. On any given day just before a report, implied volatility is climbing toward a level the stock has reached several times before, and both IV rank and IV percentile read high.
That is the normal cycle, not a signal. The question that matters before earnings is narrower: is the market pricing this report as more or less risky than past reports?
Compare like with like
The cleaner comparison is today's reading against the same point before each of the last several reports. Record implied volatility, or the implied earnings move, five trading days before each past report and compare today's number with those.
The implied move tells you the same thing in dollar terms. Our guide on estimating an earnings move from options shows how to read it from the at-the-money straddle and compare it with the stock's past reactions. That comparison, implied move against actual moves, is the one that bears on whether the options are rich or cheap for the event.
After the report
Once results are out, the event premium leaves the near expiry and implied volatility falls, often within one session. IV rank and IV percentile drop with it. A reading of 85 the day before earnings can be 30 the day after with no change in the stock's underlying risk. That drop is IV crush, and it is why a high pre-earnings IV rank should be read as "the event is priced," not "volatility is unusually high."
A decision guide
- If both measures are high and earnings fall inside the expiry, compare today with past pre-earnings readings before calling options expensive.
- If both measures are high and no event is scheduled, check the news, the filings and the options skew for what the market is paying to protect against.
- If IV rank is low but IV percentile is high, look for a spike earlier in the lookback that stretched the range.
- If IV rank is high but IV percentile is moderate, today is near a recent extreme but not unusual across the year; check whether the high was a one-off event.
- If both measures are low ahead of a known catalyst, the options may be pricing less event risk than usual, which is worth checking against the stock's history of reactions.
Catalysts other than earnings
The same logic applies to court rulings, FDA decisions, shareholder votes and deal closings, with one difference: those events rarely repeat on a schedule, so there is no set of past pre-event readings to compare against.
Announced cash acquisitions show the problem clearly. After a deal is signed, the target's implied volatility usually collapses because the stock is pinned near the offer price. A year later, IV rank and IV percentile both read near zero, but the lookback mostly measures a different company, one that was not under contract. If the deal hits regulatory trouble, implied volatility can jump and both measures read 100, which tells you something changed but not how likely the deal is to break. For that you need the merger agreement and the timeline, not the volatility history.
Where this goes wrong
- Treating the score as a valuation. IV rank and IV percentile say nothing about the move that follows. A stock can sit at an IV rank of 95 and still move more than the options priced.
- Ignoring the calendar. A high reading two days before earnings is expected. The same reading with no event scheduled deserves a closer look.
- Short or broken histories. Recent listings, spin-offs and companies emerging from restructuring have less than a year of option data, or data from a different capital structure. The lookback is not a fair baseline.
- Thin option markets. In small, illiquid stocks the implied volatility from the mid price can swing on wide quotes alone, which feeds noise into both measures. Our piece on options liquidity and wide spreads covers what to check.
- Comparing across stocks. An IV rank of 70 on a utility and 70 on a small biotech describe very different implied volatility levels. The scores are only comparable within one stock's own history.
- Trusting one platform's label. Definitions vary. Confirm whether the number on screen is rank or percentile, and which series and lookback it uses.
How to use them in research
Use IV rank and IV percentile as a first filter, then go to the raw series. Pull up the chart of implied volatility over the lookback, find the high and the low, and see what caused them. Read the option chain for the expiry that contains the event, and compare the implied move with past reactions. Check the term structure for a jump in the event expiry, which isolates how much of today's level is the catalyst itself.
The useful question is never "is IV rank high" but "is the market pricing this event differently from how it priced similar events before, and do the filings give a reason." Dombey's published research reads option pricing alongside the catalyst and the primary documents before each event; see the research archive. To see how priced moves compare with what stocks actually did, follow today's biggest stock moves.
The bottom line
IV rank places today's implied volatility between its lookback low and high; IV percentile counts the share of lookback days with lower implied volatility. IV rank is sensitive to a single spike, while IV percentile uses every day and is usually the steadier read. Before earnings, both run high for almost every stock, so compare today with the same window before past reports and with the implied move from the straddle. Treat both as context for the price of options, then judge that price against the catalyst and the stock's own history.