

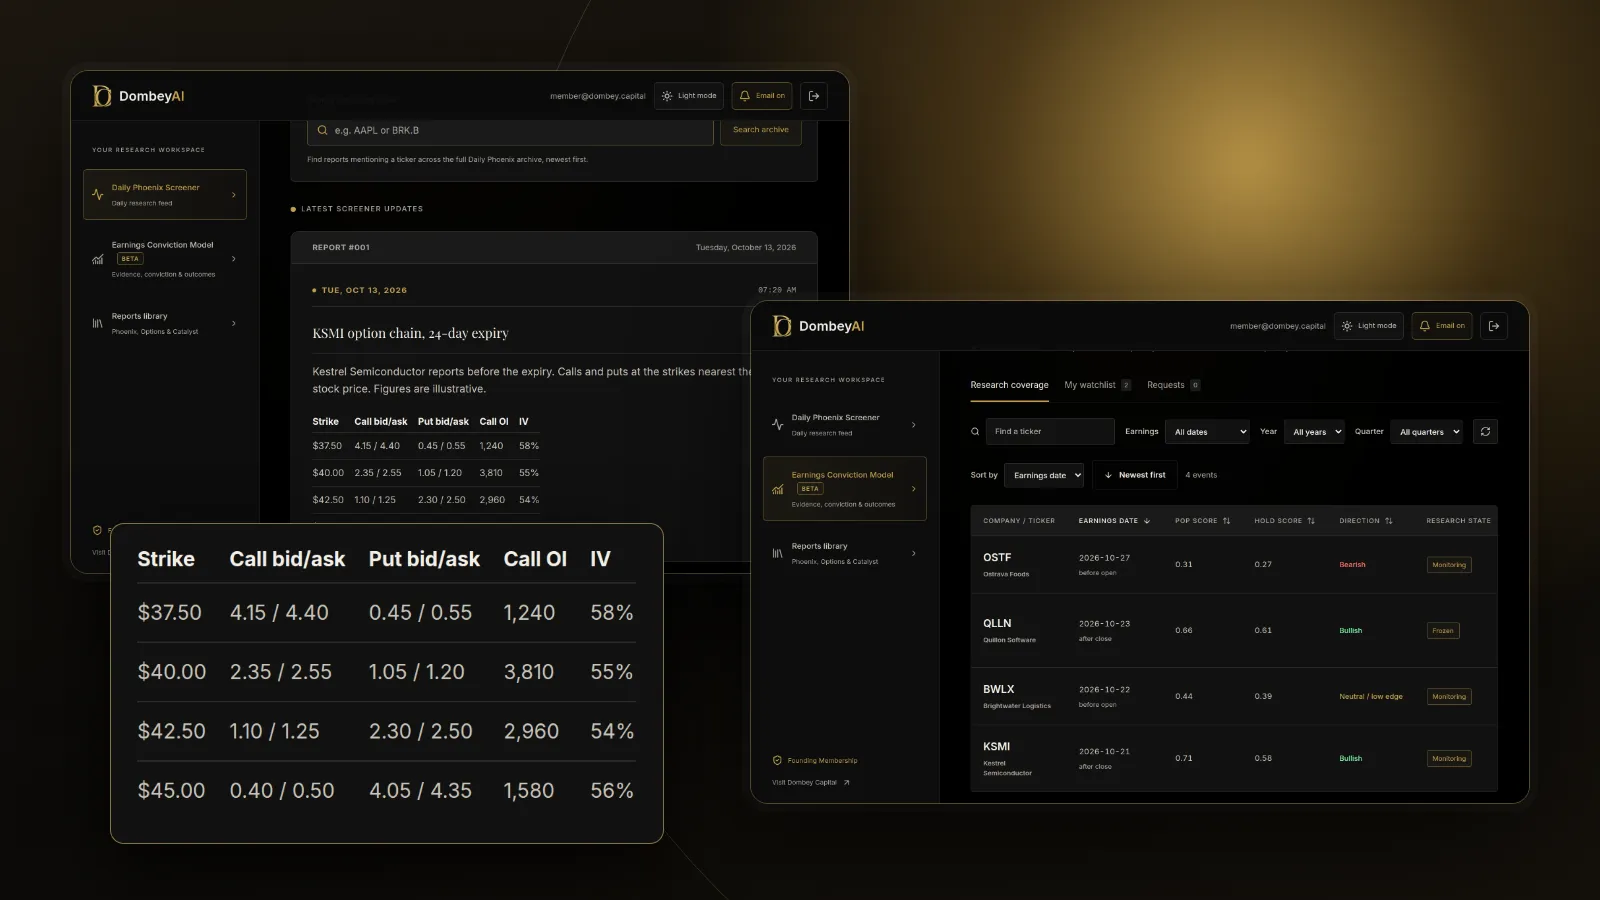
What you need
- A broker or data platform that shows a full option chain with bid, ask, volume and open interest. Most also show implied volatility and the greeks as optional columns.
- The current stock price and the time of the quote.
- Any dated event for the stock: an earnings date, a shareholder vote, a court ruling or a dividend date.
- Fifteen minutes the first time, and a few minutes per stock after that.
Step 1: Pick the expiration
A chain shows one expiration at a time, usually chosen from a row of dates or tabs across the top. Many platforms show the number of days to expiry next to each date.
Standard monthly equity options generally expire on the third Friday of the month, moved to the Thursday before when that Friday is an exchange holiday. Many stocks also have weekly expirations, and some have long-dated contracts more than a year out. Check the exact date of each contract rather than assuming.
If you are looking at a stock because of a catalyst, the first question is whether the event falls before the expiry you are reading. An option that expires the day before an earnings report does not price that report. Our guide on estimating an earnings move from options explains how to choose the first expiry after an event.
Step 2: Find the strikes and the stock price
The strike prices run down the center of the chain, lowest at the top. Calls sit on the left and puts on the right, so each row shows a call and a put with the same strike and expiry. Some platforms stack calls above puts instead, or let you show one side at a time.
Most chains mark where the current stock price falls, often with a line or a highlighted row between two strikes. Options are usually shaded when they are in the money. A call is in the money when the stock trades above its strike. A put is in the money when the stock trades below its strike. The strike nearest the stock price is called at the money.
Many platforms show only a set number of strikes around the stock price by default. If a strike you expect is missing, widen the view rather than assuming it is not listed.
Step 3: Read the bid, the ask and the last price
These are the price columns, and the order in which you read them matters.
- Bid: the highest price a buyer is currently offering. It is roughly what you could sell at.
- Ask: the lowest price a seller is currently offering. It is roughly what you could buy at.
- Mid: the halfway point between bid and ask. Some platforms show it as a column; otherwise calculate it.
- Last: the price of the most recent trade, with the change from the prior close next to it.
Read the bid and ask first. The last price can be stale. On a thinly traded contract it may come from a trade hours or days earlier, when the stock was somewhere else. Every calculation should start from the current quotes.
The gap between bid and ask is the spread. A narrow spread means the mid is close to a price you could trade. A wide spread means the mid is an estimate. Our explainer on options liquidity and wide spreads covers how to judge whether a quote is readable.
Step 4: Read volume and open interest
Volume is the number of contracts traded so far in the current session. Open interest is the number of contracts still open, and it is usually updated once a day for the prior session. A contract can trade heavily in a day while open interest stays flat, if the trades close existing positions.
Read the two together. Volume well above open interest suggests new activity today. Open interest built up at one strike shows where positions sit. Neither tells you who bought, who sold or which way anyone leans, because every contract has a holder and a writer. Our explainer on open interest sets out how to read it before a dated event, and the put-call ratio explainer covers the summary figure many chains show at the top.
Step 5: Read implied volatility and delta
Most platforms let you add an implied volatility column and the greeks. Two are worth reading on every chain.
Implied volatility (IV) is the volatility that, put into a pricing model, produces the option's current price. Higher IV means a more expensive option for the same strike and expiry. IV is usually higher in expiries that contain a scheduled event, and different strikes in the same expiry often show different IVs. The implied volatility guide explains the number, and the options skew explainer covers why it differs across strikes.
Delta estimates how much the option price changes for a $1 move in the stock, all else equal. Calls have deltas between 0 and 1, and puts between 0 and -1. At-the-money options sit near 0.50 or -0.50. Many traders also use delta as a rough guide to the chance an option finishes in the money. That reading is an approximation, not a probability you can rely on.
Platforms calculate IV and the greeks from the mid price with their own models, so two screens can show different figures for the same contract.
Step 6: Split the price into intrinsic and time value
Every option price has two parts. Intrinsic value is the amount by which the option is in the money. Time value is the rest of the premium: what buyers pay for the chance the option gains value before expiry. An out-of-the-money option has no intrinsic value, so its whole price is time value.
| Column | What it shows | What to check |
|---|---|---|
| Expiration | Date the contract expires | That any catalyst falls before it |
| Strike | Price at which the option can be exercised | Where it sits against the stock price |
| Bid and ask | Current prices to sell and buy | Spread as a share of the mid |
| Last | Most recent trade | Time of the trade |
| Volume | Contracts traded this session | Volume against open interest |
| Open interest | Contracts still open, prior session | Which strikes it is building at |
| Implied volatility | Volatility implied by the price | Compared with other expiries |
| Delta | Price change per $1 stock move | Whether it fits the strike's moneyness |
Time value tends to shrink as expiry approaches. In an expiry that contains an earnings report, much of it can disappear once the result is out; see IV crush. Adding the at-the-money call and put gives the straddle, which the expected move explainer turns into a percentage range.
Step 7: Check the contract terms
This step matters most for special situations. After a corporate action, the options on a stock can be adjusted so the contract no longer delivers 100 ordinary shares. The Options Industry Council gives examples: a 1-for-20 reverse split can change the deliverable to 5 shares of the new stock; a stock merger can convert each contract into shares of the acquirer; a cash merger generally changes the deliverable to a fixed amount of cash; a spin-off can make the deliverable 100 shares of the parent plus shares of the spun-off company. Adjustments are decided case by case by an adjustment panel.
Adjusted contracts usually carry a modified symbol, often with a numeral added to the letters, and many platforms list them in a separate chain or flag them. Their prices reflect the new deliverable, so a quote that looks mispriced against the stock may simply be for a different package. Check the contract details on any chain for a stock that has recently been through a split, merger, spin-off or special dividend.
Step 8: Set the view before you compare
Before comparing one stock's chain with another, fix the view so you are reading like with like. Choose the same columns, the same number of strikes around the price and a similar number of days to expiry. Note the time of the quote, because chains taken before the open, in the first minutes of trading or after the close often show wider spreads.
If you compare an expiry before an event with one after it, put them side by side. The difference in implied volatility between the two is a quick read on how much premium the market is charging for the event.
Dombey's weekly Options Research reads chains this way around dated catalysts; see the research archive.
Where this goes wrong
Reading a thin chain as if it were liquid. Small companies and special situations often have chains where most strikes trade rarely. A clean-looking IV or delta on such a contract rests on a soft mid price.
Trusting one platform's greeks. Vendors use different models, dividend assumptions and quote snapshots. Treat IV and delta as estimates.
Missing an event inside the expiry. An earnings date, a vote or a dividend inside the expiry changes what the prices reflect. Check the calendar before reading the chain.
Overlooking early exercise. Most listed equity options can be exercised before expiration. A seller of an in-the-money call can be assigned early, particularly before an ex-dividend date. If you are reading a chain to write options, our explainer on covered calls around catalysts covers the risks.
Reading the chain as a forecast. Prices show what buyers and sellers are paying for uncertainty today. They do not say which way the stock will move.
Common mistakes
- Forgetting the multiplier. A $0.80 option is about $80 per contract, and so is an $0.80 spread.
- Using the last price. It can be stale; use the bid, ask and mid.
- Reading the wrong expiry. Confirm the date on the tab before reading any row.
- Mixing up the sides. Calls are usually on the left and puts on the right, but some platforms stack or reverse them.
- Ignoring the shading. In-the-money and out-of-the-money options behave differently and carry different amounts of time value.
- Skipping the contract terms. An adjusted contract can deliver shares of another company or cash.
The bottom line
An option chain is one expiry at a time, strikes down the middle, calls on one side and puts on the other. Read the bid and ask before the last price, then volume and open interest, then implied volatility and delta, and remember that each contract usually covers 100 shares. Split each price into intrinsic and time value, and check the contract terms on any stock that has been through a corporate action. Read this way, the chain shows what the market is charging for uncertainty around an event, not which way the stock will go.