

Why dividend yield is not enough
For most of the last century, dividends were the main way US companies returned cash. That changed as share repurchases grew, and many companies now return more through buybacks than through dividends. A screen built on dividend yield alone misses them.
Dividend yield has a second blind spot. It does not show how the dividend is funded. A company can pay a generous dividend while issuing new shares to employees and borrowing to cover the gap. The dividend yield looks the same as for a company paying from free cash flow with no debt.
Shareholder yield addresses both problems by counting all three ways cash leaves the company for its capital providers, each on a net basis.
The formula
Shareholder yield = (dividends paid + net share repurchases + net debt paydown) / market capitalization
Each part comes from the cash flow statement:
- Dividends paid. Cash dividends to common shareholders in the period.
- Net share repurchases. Cash spent buying back shares, minus cash received from issuing shares, such as from employee option exercises. If issuance exceeds repurchases, this part is negative.
- Net debt paydown. Debt repaid minus new debt raised. If the company borrowed more than it repaid, this part is negative.
Some investors use a narrower version with only dividends and net buybacks, sometimes called net payout yield. The broad version is stricter, because it penalizes companies that borrow to fund their payouts. State which version you use.
Quick reference
| Component | Cash flow statement line | Sign | Common distortion |
|---|---|---|---|
| Dividends | Dividends paid | Positive | Special dividends inflate a single year |
| Buybacks | Repurchases of common stock | Positive | Buybacks that only offset stock-based compensation |
| Share issuance | Proceeds from issuance of stock | Negative | Option exercises and secondary offerings |
| Debt repaid | Repayments of long-term debt | Positive | Refinancing that repays one loan with another |
| Debt raised | Proceeds from borrowings | Negative | Revolver draws and repayments within the year |
| Market value | Shares outstanding times price | Denominator | Using a stale share count after large buybacks |
Worked example: two companies, one dividend yield
Company G bought back $120 million of stock and issued $30 million to employees, so net buybacks are $90 million. It repaid $150 million of debt and borrowed $50 million, so net debt paydown is $100 million. Its free cash flow was $270 million.
Shareholder yield: ($60 million + $90 million + $100 million) / $2.0 billion = 12.5%. Total cash returned of $250 million is covered by free cash flow of $270 million.
Company H bought back $160 million of stock and issued $40 million, so net buybacks are $120 million. It borrowed $220 million and repaid $40 million, so net debt paydown is minus $180 million. Its free cash flow was $90 million.
Shareholder yield: ($60 million + $120 million minus $180 million) / $2.0 billion = 0%.
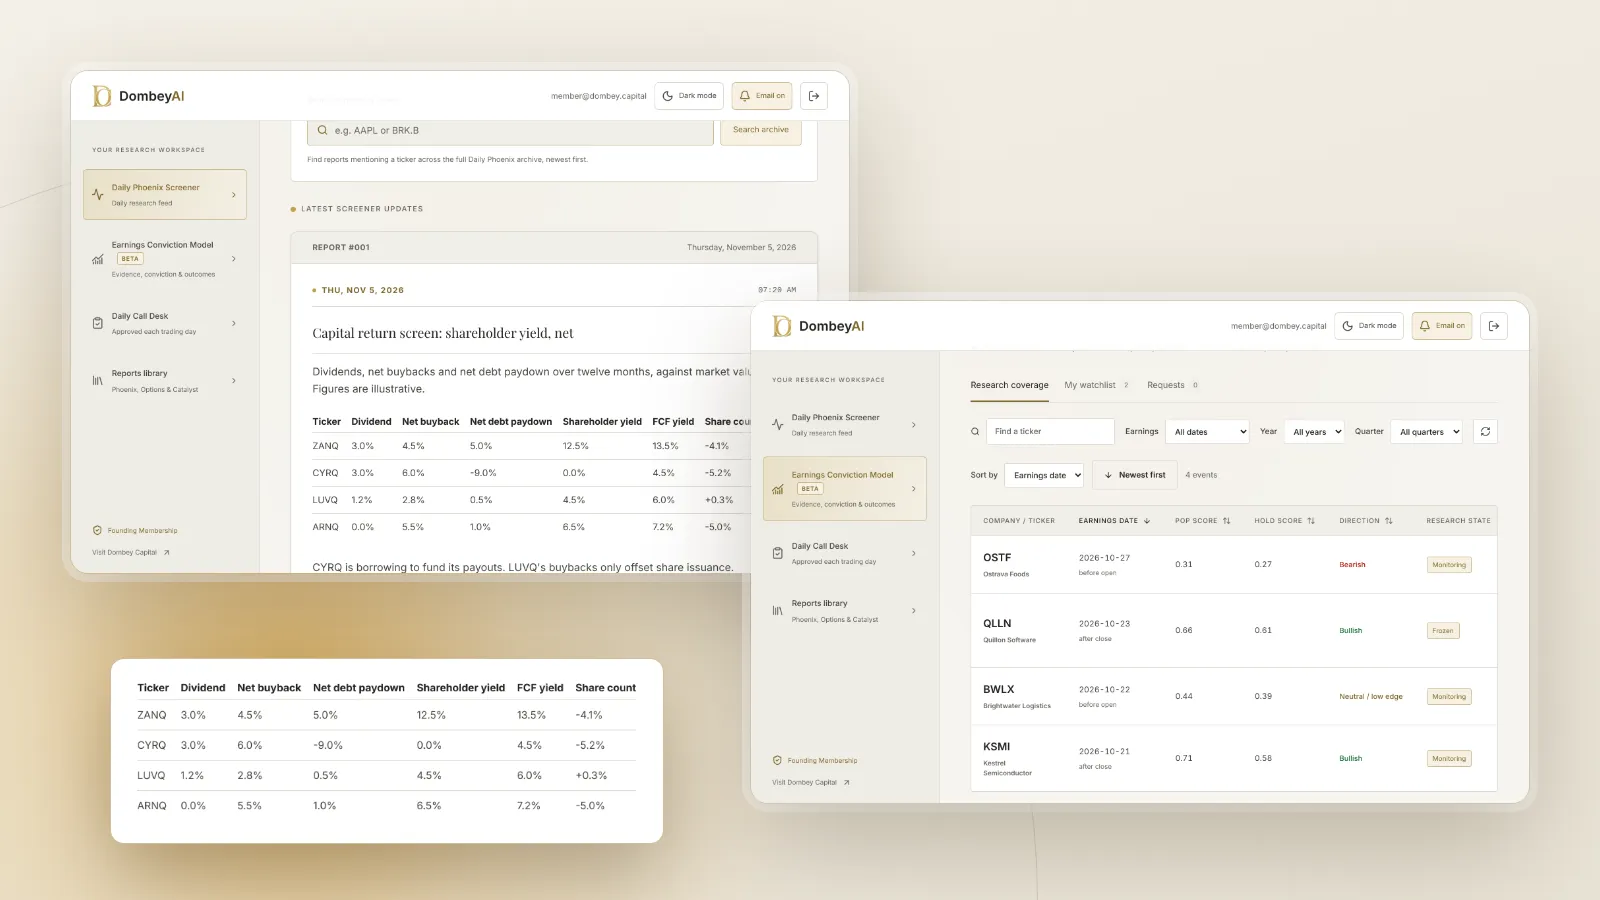
| Company G | Company H | |
|---|---|---|
| Dividend yield | 3.0% | 3.0% |
| Net buyback yield | 4.5% | 6.0% |
| Net debt paydown yield | 5.0% | -9.0% |
| Shareholder yield | 12.5% | 0.0% |
| Free cash flow yield | 13.5% | 4.5% |
On dividend and buyback yield, Company H looks more generous. Once borrowing is counted, it is returning nothing on a net basis: it is borrowing from lenders and passing the money to shareholders. That can be a reasonable choice for a company with little debt, but it cannot go on indefinitely, and the leverage it builds raises the risk for equity holders. Our explainer on the debt-to-equity ratio covers how to judge where that limit sits.
Compare it with free cash flow
Shareholder yield measures what a company paid out. Free cash flow yield measures what it generated. Read them together:
- If shareholder yield is roughly equal to free cash flow yield, the company is returning what it earns.
- If shareholder yield is well below free cash flow yield, the company is keeping cash, for investment, acquisitions or a cash buildup. Ask what it is for.
- If shareholder yield is well above free cash flow yield, the payouts are funded by something else: cash on hand, asset sales or borrowing in a version that excludes debt. That cannot last.
The same comparison works against earnings yield, but free cash flow is the better yardstick because payouts are made in cash.
The stock-based compensation problem
Many companies report large buybacks that do not reduce the share count, because they are offsetting shares issued to employees. Using net buybacks handles part of this, since cash received from option exercises is subtracted. It does not handle restricted stock units, which are issued without cash proceeds.
A practical cross-check is the share count. Compare diluted shares outstanding at the start and end of the year. If buybacks were large but the count barely moved, much of the repurchase spending was a cost of paying employees rather than a return to shareholders. Our articles on whether stock-based compensation is a real expense and on dilution and share count changes go further.
How to use shareholder yield
As a screen. Ranking companies by shareholder yield, then requiring free cash flow coverage, filters for businesses that both generate and return cash. Most of the screeners in our list of the best stock research tools for individual investors can calculate the parts, though few apply the net adjustments for you.
As a check on capital allocation. A trend over five years shows how management uses cash. A falling shareholder yield alongside rising acquisitions tells a different story from a falling yield alongside rising investment in a high-return business.
As a catalyst signal. A new buyback authorization or a plan to pay down debt can raise future shareholder yield. Our article on buybacks as catalysts covers when announced repurchases turn into actual ones.
Alongside valuation. A high shareholder yield on a cheap stock compounds: buybacks at low prices retire more shares per dollar. On an expensive stock, the same spending buys less.
Where this goes wrong
It is backward-looking. The figure reflects last year's decisions. A company can stop buying back stock tomorrow. Read the latest 10-Q and the management commentary for what comes next.
It is lumpy. A single large debt repayment or special dividend can double one year's figure. Averaging over three to five years gives a steadier picture.
Refinancing distorts the debt line. A company that repays a bond with the proceeds of a new one shows large gross flows in both directions. Only the net matters, and even that can swing with the timing of a refinancing.
It ignores price paid. Buybacks at prices above value transfer wealth from remaining holders to sellers. Shareholder yield counts the cash, not whether it was well spent.
Debt paydown is not always a gift. Repaying cheap debt while the business needs investment can hurt long-term value. The yield rewards it anyway.
Cyclical peaks flatter it. Shareholder yield is often highest at the top of a cycle, when cash flow is strong and the share price has not yet fallen. A dividend cut later can reverse it quickly.
Common mistakes
- Using gross buybacks. Always subtract shares issued, and check the share count.
- Mixing periods. Use the same twelve months for the cash flows and a current market value, and note the date.
- Forgetting preferred dividends and minority interests. In complex capital structures, some cash goes to claims ahead of common shareholders. Our guide on reading a cash flow statement shows where these sit.
- Comparing across industries without context. A utility and a software company return cash for different reasons and at different stages. Compare within peers.
Dombey's published research looks at how a company funds its payouts before treating a high yield as support for a stock; see the research archive.
The bottom line
Shareholder yield adds dividends, net buybacks and net debt paydown, then divides by market capitalization, giving a fuller measure of cash returned than dividend yield. Its value lies in the net adjustments, which strip out shares issued to employees and payouts funded by borrowing. Compare it with free cash flow yield to see whether the returns are sustainable, and average it over several years to smooth out one-off flows. A high shareholder yield backed by free cash flow and a falling share count is meaningful; a high one backed by new debt is not.