

What earnings power value measures
Most valuation models start with a forecast. EPV starts with the present. It asks a narrow question: if this company kept earning what it can sustainably earn today, forever, and never grew, what would that stream of earnings be worth?
The answer is a perpetuity. A business that can sustainably produce $10 million a year of after-tax operating earnings, with a 10% cost of capital, has an EPV of $100 million. Nothing about future market share, new products or margin expansion enters the number.
That restraint is the point. Forecasts are where most valuation errors live, and EPV removes them. What remains is a set of judgments about the present: what normal margins look like, how much the company must spend to stand still, and what return investors require. Each of those can be checked against the filings. If you want the full forecasting approach for comparison, see what a discounted cash flow model is.
The EPV formula, step by step
EPV comes from four adjustments to reported earnings.
- Normalize operating income. Use an average operating margin across a full business cycle, applied to current sales. A peak or trough year distorts the result. Strip out one-time charges and gains, the same way you would when estimating normalized earnings.
- Replace depreciation with maintenance capital spending. Reported depreciation is an accounting estimate. What matters is the cash the business must spend to keep its current capacity. If depreciation exceeds maintenance capital spending, add the difference back; if it falls short, subtract it.
- Tax at a normal rate. Apply a sustainable tax rate rather than a year flattered by credits or losses.
- Divide by the cost of capital. Greenwald generally uses the weighted average cost of capital, so the result is the value of the whole operating business. Our explainer on WACC covers how that rate is built.
The value of the equity then follows: EPV of the operations, plus excess cash and investments not needed to run the business, minus debt and other claims that rank ahead of shareholders.
Estimating maintenance capital spending
Companies do not report maintenance capital spending, so it must be estimated. Greenwald's shortcut:
- Work out the average ratio of net property, plant and equipment to sales over several years.
- Multiply that ratio by the increase in sales this year. The result is an estimate of growth capital spending.
- Subtract growth capital spending from total capital spending. What is left is maintenance capital spending.
The shortcut assumes the business needs a steady amount of fixed assets per dollar of sales. It works reasonably for mature manufacturers and retailers and poorly for companies in the middle of a large build-out.
Quick reference
| Item | What to use | Where to find it |
|---|---|---|
| Sales | Current revenue, adjusted for any known divestiture | Income statement in the 10-K or 10-Q |
| Operating margin | Average over a full cycle, after one-time items | Five to ten years of 10-Ks |
| Depreciation adjustment | Depreciation minus maintenance capital spending | Cash flow statement and PP&E note |
| Tax rate | A sustainable statutory or normal effective rate | Income tax footnote |
| Cost of capital | Weighted average cost of capital | Your own estimate |
| Excess cash | Cash above what operations need | Balance sheet and liquidity discussion |
| Debt and claims | Debt, leases if treated as debt, preferred stock, minority interests | Balance sheet and footnotes |
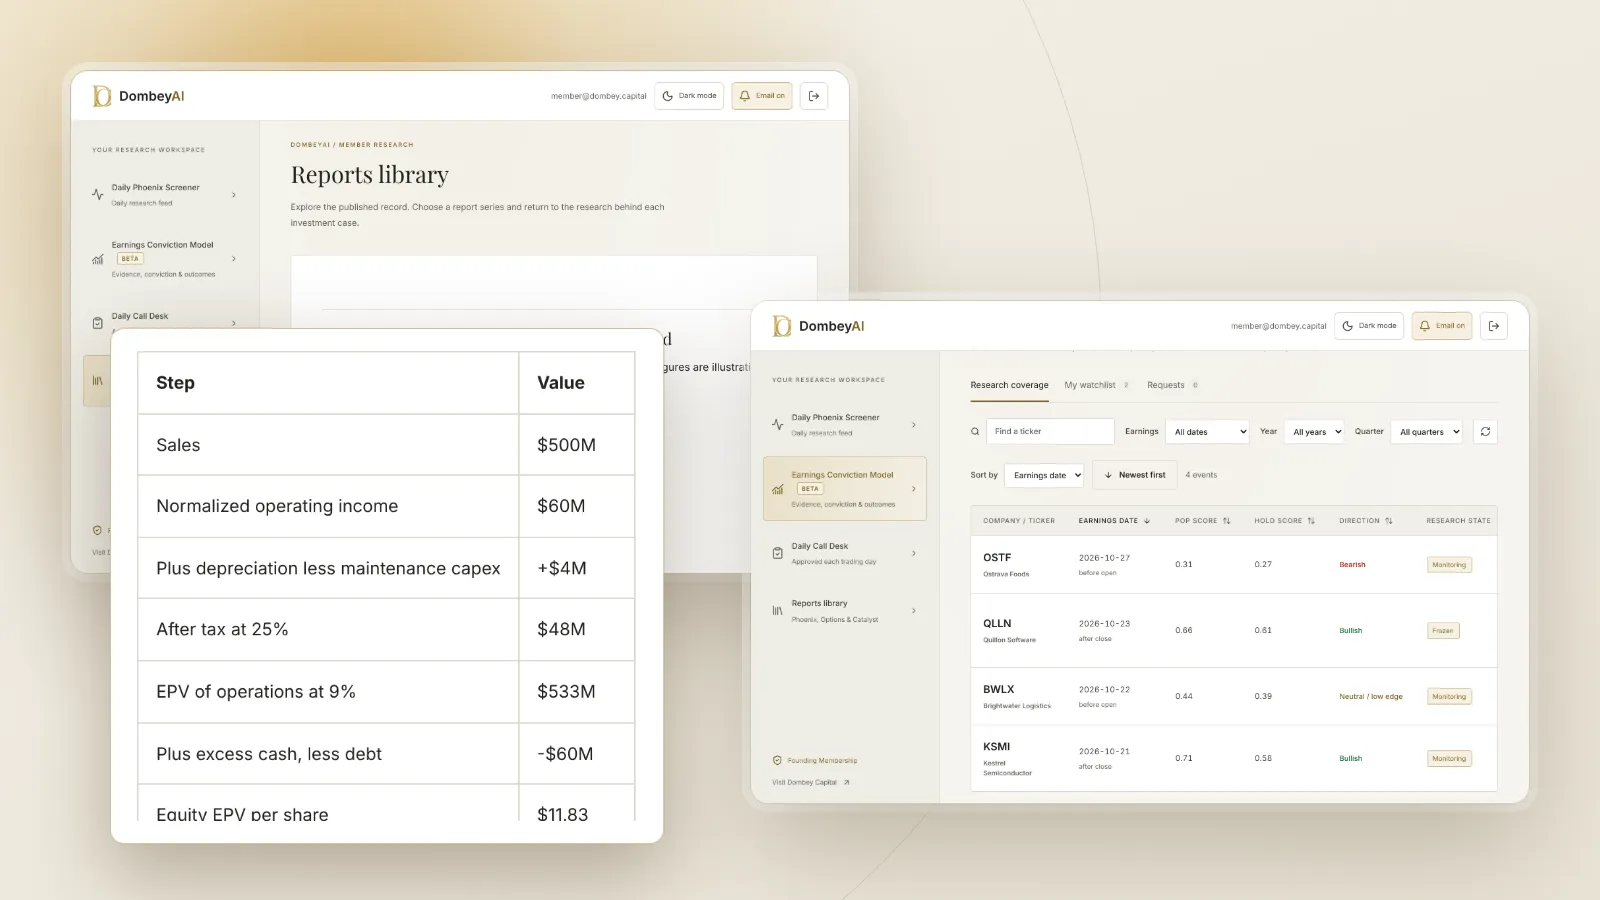
Worked example
The steps:
- Adjusted operating income: $60 million plus ($20 million depreciation minus $16 million maintenance spending) equals $64 million.
- After tax at 25%: $48 million.
- Divided by a 9% cost of capital: EPV of the operations is about $533 million.
- Plus $60 million of excess cash, minus $120 million of debt: equity EPV is about $473 million.
- With 40 million shares, that is about $11.83 a share.
If the shares trade at $9.00, the market capitalization is $360 million, and the market is paying less than the no-growth value of the current business. That is not a conclusion; it is a question. Either the normalized margin is too generous, the cost of capital is too low, or the market is pricing in a decline that the EPV assumes away.
The sensitivity to the discount rate is large:
| Cost of capital | EPV of operations | Equity EPV per share |
|---|---|---|
| 8% | $600M | $13.50 |
| 9% | $533M | $11.83 |
| 10% | $480M | $10.50 |
| 11% | $436M | $9.41 |
A two-point change in the discount rate moves the per-share value by more than 20%. That is why EPV is best presented as a range.
EPV against asset value: the franchise test
Greenwald's framework has three layers: asset value, earnings power value and growth value. EPV earns its place in the middle.
Asset value is what it would cost a competitor to reproduce the company's assets today: inventory, receivables, plant, and an estimate for intangibles such as a customer list or a trained workforce. For a business in decline, liquidation value may be the better floor; see liquidation value against book value.
The comparison tells you about competition:
- If EPV is roughly equal to asset value, the business earns about its cost of capital. That is what competition should produce when entry is easy.
- If EPV is well above asset value, the business earns more than a new entrant could. Something keeps rivals out: customer captivity, cost advantages from scale, or regulation. The gap is the value of the franchise.
- If EPV is below asset value, the assets earn less than their cost of capital. Management may be misusing them, or the industry has too much capacity.
In the example, if reproducing Company A's operating assets would cost $400 million, an EPV of $533 million implies a franchise worth about $133 million. The analyst's job is to name what protects it and judge whether it will last.
Where growth fits
Growth is the third layer, and EPV makes its value easier to see. Growth adds value only when the company earns more on new capital than that capital costs. A company earning exactly its cost of capital can double in size without creating anything for shareholders. A company earning below it destroys value as it grows.
That gives EPV two different roles:
- For a company with a durable franchise, EPV is a floor. Growth inside the franchise adds value on top.
- For a company without one, EPV is close to the whole value. Paying for growth means paying for something that may not earn its keep.
A useful check is to compare the market price with EPV. If the price is far above EPV, the market is paying for growth, and you should be able to explain why that growth earns more than its cost of capital. Return on invested capital is the measure to test it with, and a reverse DCF shows how much growth the price assumes.
Where this goes wrong
The normalized margin is wrong. If the past cycle included an unusual boom, the average margin overstates earning power. If the business has lost its position, history no longer applies at all. Read the 10-K's discussion of competition before trusting a long average.
Maintenance capital spending is misjudged. The PP&E-to-sales shortcut fails when a company is replacing an old plant, building capacity ahead of demand, or shifting to a lighter model. Small errors here move EPV materially.
The discount rate does the work. Because EPV is a perpetuity, the result is inversely proportional to the cost of capital. Choosing 8% instead of 10% adds 25% to the value. Decide the rate before you see the answer, and use the same rate across companies of similar risk.
Hidden claims are left out. Underfunded pensions, operating leases, preferred stock and minority interests all sit ahead of common shareholders. Our article on pension liabilities explains one of the most common omissions.
The business is shrinking. EPV assumes the current earnings continue. For a company in structural decline, that overstates value, and the falling earnings may look cheap on every multiple. That is the classic value trap.
Common mistakes
- Using reported net income. Interest, unusual items and the actual tax line all distort it. Start from operating income.
- Counting operating cash as excess. A retailer needs cash in its tills and a manufacturer needs working capital. Only cash beyond that is excess.
- Ignoring stock-based compensation. It is a real cost of running the business and belongs in operating expenses; see whether stock-based compensation is a real expense.
- Presenting one number. A single EPV hides the two assumptions that drive it. Show a grid of margins and discount rates.
How EPV fits into a research process
EPV works best as a cross-check, not a verdict. It sits well beside owner earnings, which uses a similar idea of maintenance spending, and beside simple multiples such as earnings yield. When the market price sits below a conservative EPV, the next step is to find out why: a catalyst, a temporary problem, or a decline the EPV has not captured.
Most of the inputs come straight from the 10-K, so a basic data tool and the filings are enough. If you want help pulling ten years of margins and capital spending quickly, our guide to the best stock research tools for individual investors compares the options. Dombey's published research uses no-growth values like this as one check before writing on a cheap stock; see the research archive.
The bottom line
Earnings power value is the no-growth value of a company's current, sustainable earnings: normalized after-tax operating income divided by the cost of capital, plus excess cash and minus debt. Its strength is that it avoids forecasts; its weakness is that the discount rate and the maintenance spending estimate drive the answer. Compared with asset value, it shows whether a business has a franchise worth paying for. Compared with the market price, it shows how much of that price depends on growth.