

What you need
- The latest 10-K and the two before it, from SEC EDGAR. The segment note in each gives three years of figures.
- The latest 10-Qs. Under the 2023 update, segment profit and expenses now appear in interim reports too.
- The earnings release and investor presentation, which sometimes give more segment detail than the filing.
- A spreadsheet with one tab per segment.
- About two hours for a company with three to five segments.
Step 1: Find the note and the segment definitions
Search the 10-K for "segment information." The note opens by naming the reportable segments, describing what each sells and identifying the chief operating decision maker (CODM) by title. Since the FASB's ASU 2023-07, companies must name that title and explain how the CODM uses the segment profit measure.
Write down the segment names and one line on each. If the company has changed its segments in the last three years, note the date. Prior periods must be recast to the new structure, so use the recast figures.
Step 2: Record revenue and profit per segment
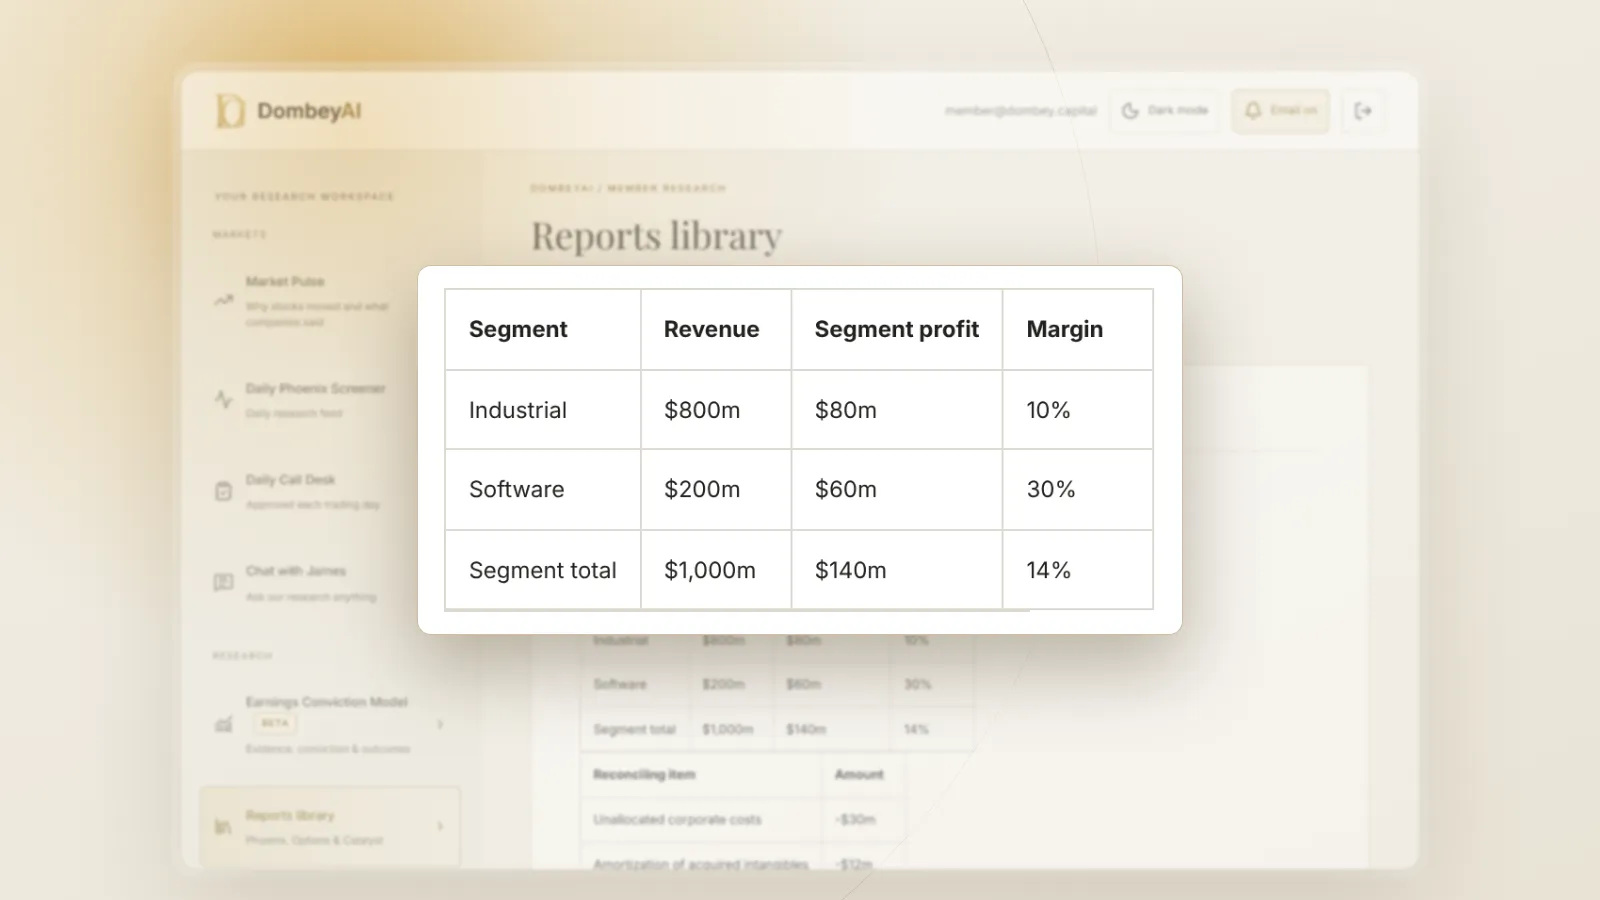
Build a table with three years of revenue and segment profit for each segment. Note which profit measure the company uses: operating income, adjusted EBITDA, contribution margin or something else. Companies choose the measure the CODM uses, so it is not always a GAAP figure. ASU 2023-07 allows a company to disclose more than one measure if the CODM uses more than one, but at least one must be the measure closest to GAAP.
| Segment | Revenue, year 1 | Revenue, year 3 | Profit, year 3 | Margin, year 3 |
|---|---|---|---|---|
| Segment 1 | ||||
| Segment 2 | ||||
| Segment 3 |
Step 3: Read the significant segment expenses
The new expense disclosure is the most useful change in years. Public companies must show the significant expenses regularly provided to the CODM for each segment, such as cost of sales, selling expenses or research and development, and an "other segment items" line for the rest.
This lets you see why margins moved. A segment whose margin rose because cost of sales fell is different from one whose margin rose because marketing was cut. If the company provides only the expense categories required, compare them with the income statement to see what is left in other items.
Step 4: Rebuild margins and growth over time
For each segment, calculate revenue growth and profit margin for every year available. Look for:
- A segment growing fast with thin or negative margins, which may be subsidized by the others.
- A segment with stable revenue and falling margins, which can signal price pressure.
- A small segment with high margins, which can be worth more than its share of revenue suggests.
Step 5: Read the reconciliation
Segment profit rarely adds up to consolidated operating income. The reconciliation table shows the gap:
| Reconciling item | What it is | Why it matters |
|---|---|---|
| Unallocated corporate costs | Head office, public company costs, some IT | A real cost that a sum-of-the-parts value must subtract |
| Intersegment eliminations | Sales between segments | Inflated segment revenue if one segment sells to another |
| Amortization of acquired intangibles | Often excluded from segment profit | Can make acquisitive segments look more profitable |
| Restructuring and one-off items | Charges excluded by management | Check whether they recur every year |
| Stock-based compensation | Sometimes held at corporate | A real cost; see whether stock comp is a real expense |
If unallocated costs grow faster than revenue, the segments are flattering the whole.
Step 6: Check assets, capex and depreciation
Many companies disclose assets, capital expenditure and depreciation by segment. Compare capex with depreciation for each. A segment spending well above depreciation is investing for growth; one spending below may be underinvesting. The distinction is covered in maintenance capex versus growth capex. If assets are disclosed, segment profit divided by assets gives a rough return on capital for each.
Step 7: Read the entity-wide disclosures
After the segment tables, the note gives three more breakdowns that apply to the whole company:
- Revenue by product or service, if the segments mix several.
- Revenue and long-lived assets by geography, with the home country and any material foreign country shown separately.
- Major customers: the existence of any customer accounting for 10% or more of revenue, and which segments serve it. The customer's name is often not required.
A 10% customer in a small segment can be a concentration risk the headline numbers hide.
Step 8: Compare with MD&A and the earnings call
Read the MD&A discussion of each segment and the latest call transcript. Management often gives drivers, such as volume, price and mix, that explain the segment numbers. Note any segment that management discusses less than its size warrants. Reading an earnings call transcript closely helps with that.
Step 9: Use the results
Segment data feeds three common analyses:
- Sum-of-the-parts. Value each segment on its own profit and multiple, subtract capitalized corporate costs and net debt. The steps are in how to do a sum-of-the-parts valuation.
- Spin-off candidates. A high-margin segment inside a low-multiple company is a common setup for a separation. See spin-off investing.
- Forecasting. Forecast each segment separately, then add them up, rather than forecasting the total.
Tools that pull segment data into spreadsheets are compared in the best stock research tools for individual investors.
A checklist for each 10-K
| Step | What to check | Where to find it |
|---|---|---|
| Segments | Names, count and any change from last year | Opening paragraphs of the segment note |
| CODM | Title and how the profit measure is used | Segment note |
| Profit measure | GAAP or adjusted, and what it excludes | Segment note and reconciliation |
| Significant expenses | Categories shown and size of "other segment items" | Segment expense table |
| Reconciliation | Corporate costs, eliminations, excluded charges | Reconciliation table |
| Capital | Assets, capex and depreciation by segment | Segment tables |
| Entity-wide | Product, geographic and major customer revenue | End of the segment note |
| Narrative | Drivers and outlook by segment | MD&A |
Run the checklist every year and keep the results in the same spreadsheet. Changes from one year to the next, such as a new segment, a larger "other" line or a customer crossing 10% of revenue, are often the most useful findings. If something changed and the company does not explain it, the footnotes in the 10-K and the SEC's comment letters on the filing sometimes do.
Common mistakes
- Ignoring unallocated costs. Adding up segment profit and applying multiples overstates value by the capitalized corporate cost.
- Comparing non-recast history. After a resegmentation, old 10-Ks show a different structure. Use the recast figures.
- Treating adjusted segment profit as GAAP. The segment measure is whatever the CODM uses. Check what it excludes.
- Missing intersegment sales. A segment that sells mainly to another segment has less independent value than its revenue suggests.
- Comparing segments across companies. Two companies' "services" segments may include very different activities.
The bottom line
Segment disclosures show a company the way its leaders review it, and since the 2023 FASB update they include the significant expenses behind each segment's profit. Read the note, rebuild margins over three years, and spend the most time on the reconciliation, where corporate costs and excluded items sit. Then compare with MD&A. For sum-of-the-parts and spin-off analysis, segment data is the starting point, and the reconciling items are often where the case is won or lost.