

What you need
- A screener or data source that exports raw balance sheet fields: total current assets, total liabilities, preferred stock, shares outstanding, market cap, and the date of the latest balance sheet. Best stock screeners for value investors compares several.
- A spreadsheet. Most screeners do not offer NCAV as a ready field, and the ones that do rarely show how they computed it.
- Access to SEC EDGAR for the hand check. How to search SEC EDGAR filings covers the search tools.
- Average daily dollar volume, or price and volume, so you can filter for tradeability.
- A log with one row per candidate per screen run.
Step 1: Define the universe and the exclusions
Decide what the screen will look at before it looks at anything. A clear universe keeps results comparable from one run to the next.
Start with every listed and over-the-counter company that files with the SEC. Then exclude the groups where NCAV does not mean what it should:
- Financial companies. Banks, insurers and brokers often do not classify assets as current or noncurrent, so current assets is missing or meaningless.
- Funds, trusts and closed-end vehicles. Their value is measured by net asset value, which is a different test.
- Companies with no recent periodic report. If there is no 10-Q or 10-K in the last year, there is no balance sheet to screen.
- Foreign private issuers, unless you handle currency. Filers on Form 20-F report annually in their home currency. Include them only if your data converts both price and balance sheet to the same currency on sensible dates.
Write the exclusions down. If you change them later, note the date, because results before and after the change are not comparable.
Step 2: Build NCAV from raw fields
Compute the ratio yourself so you know exactly what went into it.
NCAV = total current assets minus total liabilities minus preferred stock
Price to NCAV = market cap divided by NCAV
Use total liabilities, not current liabilities. Long-term debt, lease liabilities and pension obligations all rank ahead of common holders. Treat preferred stock at its liquidation preference where your data provides it, since the carrying value can be lower.
Add a second, haircut column at the same time. A common convention is cash and short-term investments at full value, receivables at about 75%, and inventory at about 50%. Graham used similar discounts in his liquidating value estimates. The haircut column needs the breakdown of current assets, so export cash, receivables and inventory as separate fields.
| Column | Formula | Why it is there |
|---|---|---|
| NCAV | Current assets minus total liabilities minus preferred | The base test |
| Price to NCAV | Market cap / NCAV | First-pass filter |
| Adjusted NCAV | Cash + 0.75 x receivables + 0.5 x inventory + other current, minus liabilities and preferred | Allows for weak receivables and stock |
| Price to adjusted NCAV | Market cap / adjusted NCAV | Ranking and second-pass filter |
| Balance sheet date | From the data source | Staleness filter |
| Share count change | Latest shares / shares a year ago | Dilution flag |
Drop any row where NCAV is zero or negative. A negative NCAV produces a negative ratio that sorts to the top of the list and looks like the cheapest stock in the market.
Step 3: Set thresholds in two passes
Run a loose pass first, then a strict one. Starting strict on dirty data hides the errors you need to see.
First pass: price to NCAV below 1.0. This is the plain net-net test. It produces the widest list and shows you what kind of data problems your source has.
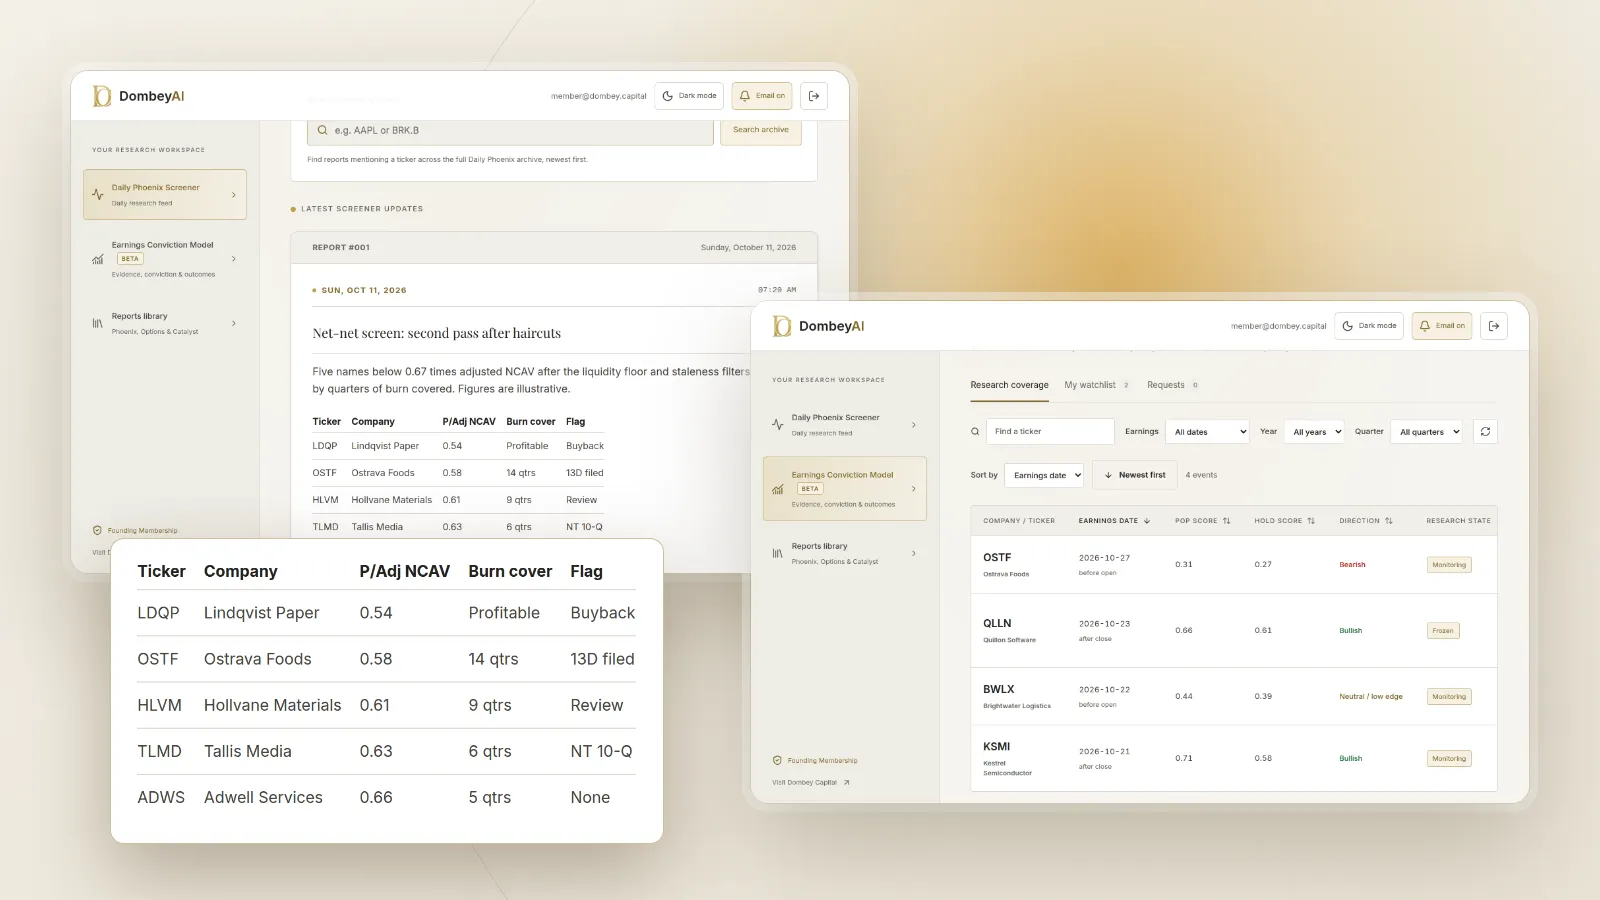
Second pass: price to adjusted NCAV below 0.67. This combines Graham's two-thirds rule with the haircuts. It leaves far fewer names, and those names have a margin that survives some error in the inputs.
Add a liquidity floor to both passes. A minimum average daily dollar volume, or a minimum market cap, removes shares that cannot be bought in a reasonable number of days. Set the floor from your own position size: if a position would be more than a small share of a typical day's trading, the stock is too thin for you, whatever its discount.
Step 4: Filter out stale and late data
A net-net screen pairs today's price with a balance sheet that can be months old. Control for that explicitly.
Balance sheet age. Flag any row where the balance sheet date is more than about five months old. A 10-Q is due 40 days after quarter end for large accelerated and accelerated filers and 45 days for all other registrants. A 10-K is due 60, 75 or 90 days after fiscal year end, depending on filer status. Small companies, which supply most net-nets, file on the longest schedules, so a balance sheet can be more than four months old before the next one is due.
Late filers. A company that cannot file on time submits Form 12b-25 (an "NT 10-Q" or "NT 10-K" on EDGAR). It extends the deadline by five calendar days for a 10-Q and fifteen for a 10-K. A late filing is a warning about controls, auditors or a pending restatement. Flag these rows rather than removing them, and read the notice.
Share count changes. Compare shares outstanding with a year earlier. A large increase means NCAV per share has been diluted, and the screener may be using an old count. A large decrease may mean a reverse split that the data has not caught.
Going concern language. If the latest audit report or 10-Q includes substantial doubt about the company's ability to continue as a going concern, the current assets may not be available to holders. What is a going concern warning explains what the language means.
Step 5: Rank the survivors
Sorting by the raw discount puts the weakest companies first. A stock at 0.3 times NCAV is usually there because the market expects the current assets to disappear. Rank on measures that allow for that.
- Price to adjusted NCAV. The haircut ratio from Step 2.
- Quarters of burn covered. Divide adjusted NCAV by quarterly cash burn (operating cash flow plus capital spending, if negative). A company with three years of NCAV at its current burn ranks above one with three quarters. How to estimate cash runway sets out the arithmetic.
- Burn-adjusted ratio. Subtract four quarters of burn from adjusted NCAV and recompute the ratio. A company that is profitable or breaking even keeps its full NCAV.
- A visible path. Mark companies with an authorized buyback, a strategic review, an activist 13D or a stated plan to return cash. This is a flag, not a score.
Step 6: Verify by hand and log each run
No screen output is a net-net until a person has checked it against the filing. Work down the ranked list and stop when your research time for the run is used up.
For each name, open the latest 10-Q or 10-K on EDGAR and confirm current assets, total liabilities, preferred stock and the share count on the cover page. What is a 10-Q covers where each figure sits. Then read the commitments and contingencies note and the subsequent events note, which can change NCAV after the balance sheet date.
Log every candidate the screen produces, including the ones you reject, with the reason:
| Run date | Company | Screen ratio | Filed ratio | Result |
|---|---|---|---|---|
| Week 1 | Company A | 0.58 | 0.61 | Pass, buyback authorized |
| Week 1 | Company B | 0.49 | 1.40 | Reject, preferred stock missing from data |
| Week 1 | Company C | 0.62 | 0.66 | Watch, NT 10-Q filed |
| Week 1 | Company D | 0.55 | 0.92 | Reject, shares doubled after quarter end |
The companies and figures above are hypothetical and illustrative. Over several runs, the log shows which data fields your source gets wrong, which saves time on the next run. Names that pass go into a written thesis with a date; how to write a dated investment thesis shows a format. Dombey's published research applies the same filters before each dated catalyst; see the research archive.
Cadence. Re-run the full screen after each filing wave, about six to seven weeks after each quarter end, when most smaller companies have reported. Between waves, a weekly price refresh against the existing NCAV figures catches companies that have newly fallen below the threshold.
Common mistakes
- Using current liabilities instead of total liabilities. This turns the screen into a working capital test and lets heavily indebted companies through.
- Trusting a ready-made NCAV field. Many screeners do not say whether they include preferred stock or how they treat leases. Compute it yourself.
- Sorting by the deepest discount. The cheapest names are often the ones closest to failure. Rank on the adjusted and burn-adjusted ratios.
- Ignoring the balance sheet date. A current price against a balance sheet from two quarters ago is not a valid ratio for a company burning cash.
- Missing dilution after quarter end. Shares issued after the balance sheet date appear in the subsequent events note and on the next cover page, not in the screener.
- Changing the rules between runs. If the threshold, haircuts or exclusions change, earlier results are no longer comparable. Record the change and its date.
Where this goes wrong
A well-built screen still finds companies the market has good reasons to doubt. It cannot see management that intends to keep the cash, a controlling holder who blocks any return of capital, or a business whose losses will accelerate. It measures the balance sheet on one date, and NCAV can fall sharply in a single quarter. Thin trading can make a position impossible to exit at a price near the screen value. Data quality on small and over-the-counter companies is poor enough that the hand check is not optional. The screen narrows the field; it does not establish a margin of safety on its own.
The bottom line
Screening for net-nets means computing NCAV from raw fields, applying a loose and then a strict threshold, and removing stale, late and untradeable names before ranking. Rank on NCAV after haircuts and burn, not on the raw discount. Check each candidate against the latest filing and log the result, including rejections. Re-run on the filing calendar so the balance sheet and the price stay close in time.