

Where the idea comes from
Amos Tversky and Daniel Kahneman described anchoring in a 1974 paper in Science, Judgment under Uncertainty: Heuristics and Biases. In one experiment, participants watched a wheel of fortune land on a number, then estimated the percentage of African countries in the United Nations. Those who saw a higher number gave higher estimates than those who saw a lower one, even though the number was plainly random.
The finding that matters for investors is not that people use reference points. It is that they adjust too little from them. The starting number pulls the final judgment toward itself, and people rarely notice the pull.
Markets are full of numbers that can serve as anchors, and most of them are prices. Prices feel like facts, so anchors drawn from them feel like evidence.
The anchors investors use most
| Anchor | How it distorts judgment | Better question |
|---|---|---|
| Your purchase price | Selling below cost feels like admitting a loss, so you wait for break even | What is it worth now, against the price now? |
| The 52-week or all-time high | A large fall looks like a discount | Did the fall reflect a change in value? |
| A failed takeover price | The old bid looks like proof of value | Would that buyer, or any buyer, pay it today? |
| An analyst target price | The target frames what "fair" means | What assumptions sit behind it, and do they hold? |
| Your first valuation | Later evidence only nudges the estimate | If I started today, what would I estimate? |
| A round number | $100 or $10 feels like support or resistance | Is there any reason in the business for that level? |
The purchase price
The most common anchor is the price you paid. It matters to you, through taxes and through the feeling of a gain or loss. It means nothing to the stock. Other buyers and sellers do not know your cost, and the business does not care about it.
The pattern this creates is familiar: holding a stock that has fallen until it "gets back to even", and selling a stock that has risen because the gain feels like something to protect. Neither decision starts from the only relevant comparison, which is value against price today. There is one legitimate reason to think about cost: taxes. Realizing a loss can have value, as our explainer on tax-loss selling covers. That is a reason to sell, not a reason to hold.
The old high
A stock that has fallen 60% from its high looks cheap on a chart. Whether it is cheap depends on why it fell. If the high reflected growth expectations that have since failed, the old price is not a measure of anything. Many value traps look attractive mainly because of how far they have fallen.
The deal price
In special situations, the anchor is often a takeover price. After a deal breaks, holders point to the offer as proof of what the company is worth. Sometimes that is fair: a strategic buyer saw value the market had missed. Often the bid reflected conditions that no longer apply, such as cheaper financing or a buyer who has since walked away for good reasons. Our explainer on deal breaks covers where target stocks tend to trade afterwards and why.
Anchoring inside your own research
The hardest anchors to see are the ones you create. An early estimate of value becomes the base, and each new piece of evidence moves it a little rather than replacing it.
Suppose your first model of a company gave a value of $30 a share. Over the next quarter, the company cuts guidance, a competitor enters, and margins narrow. Each item feels minor, so you trim the estimate to $28, then $27, then $26. A fresh analyst, looking at the same facts with no prior number, might reach $20. The distance between $26 and $20 is the anchor.
The same thing happens with probabilities. An analyst who first put a 70% chance on a regulatory approval tends to keep the figure near 70% as mixed news arrives. Starting from the base rate for similar cases, then adjusting for what is specific to this one, gives a cleaner estimate.
Worked example: re-underwriting from a blank page
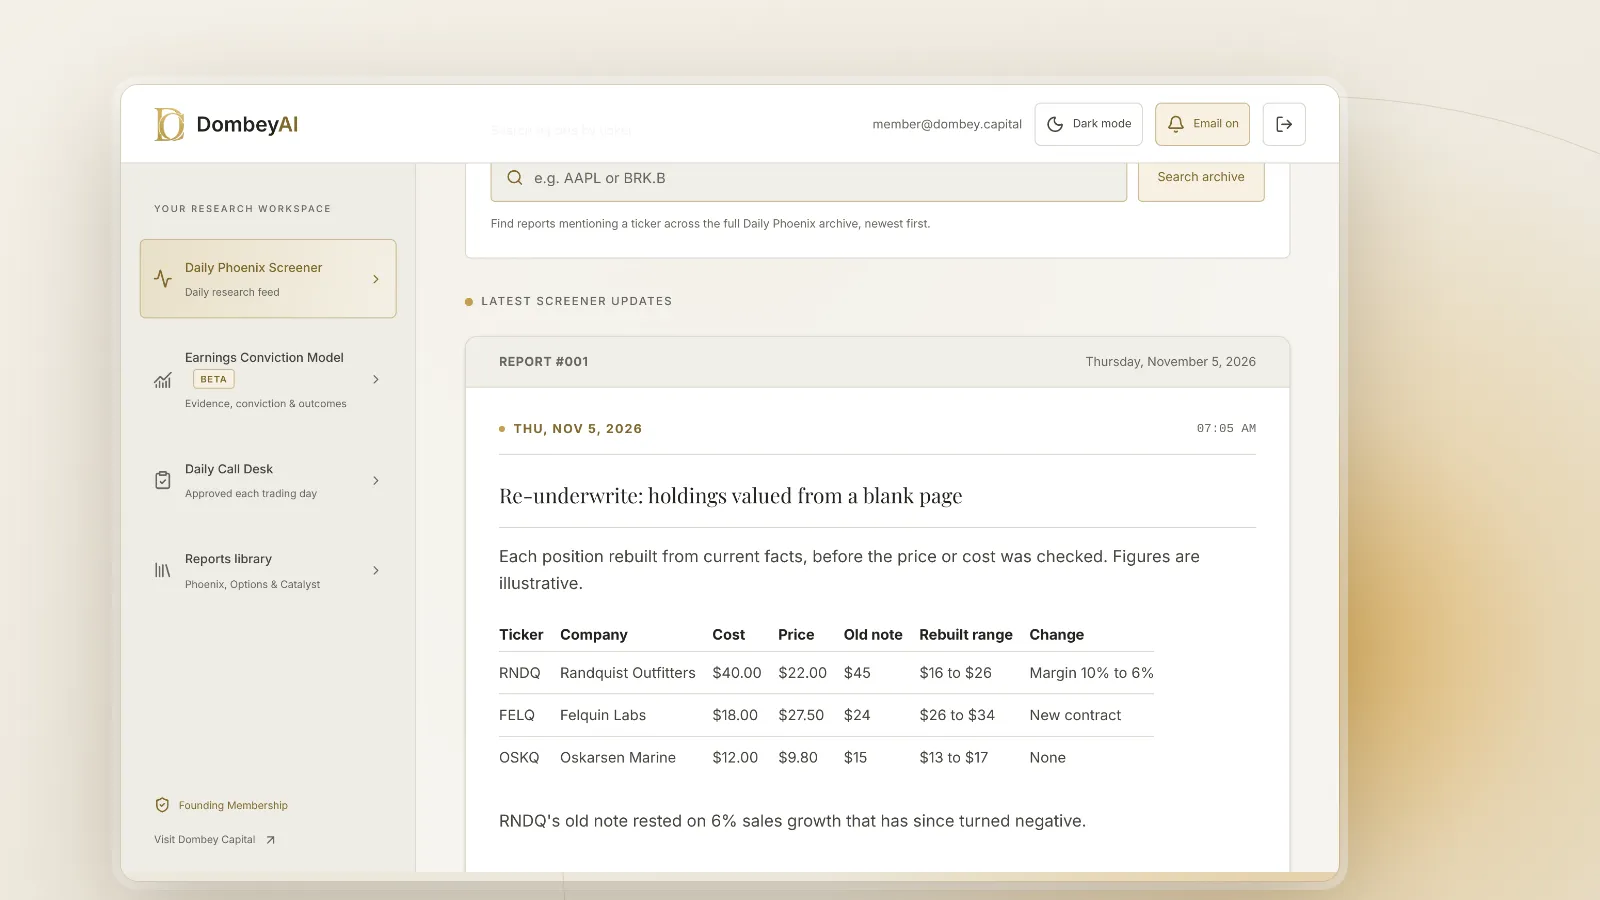
The investor's notes say "fair value $45, now at a 50% discount". That $45 came from the original assumptions. Rebuilding the estimate from today's facts:
- Start with the current business. At today's 6% margin on $1.2 billion of sales, operating income is $72 million.
- Apply a sober multiple. At 8 times operating income for a shrinking retailer, the business is worth about $576 million.
- Adjust for the balance sheet. With $96 million of net debt and 30 million shares, the equity is worth about $16 a share.
- Test the upside case separately. If margins recover to 9%, the same math gives about $26.
The rebuilt range is $16 to $26, with the current price of $22 inside it. The stock is not at a 50% discount to anything except an anchor. That does not settle whether to hold, but it changes the question from "when does it recover" to "is the recovery case likely enough to justify the downside".
A decision list for spotting anchors
- If you find yourself waiting for a stock to return to your cost, ask whether you would buy it today at the current price.
- If the main argument for a stock is how far it has fallen, find the reason it fell before treating the fall as a discount.
- If a valuation has moved only a little after several pieces of bad news, rebuild it from the current facts instead of adjusting the old figure.
- If a target price or old bid frames your view, write down the assumptions behind it and check each one.
- If you cannot say what would change your estimate, the estimate is probably resting on an anchor rather than on evidence.
How to reduce anchoring
Estimate value before you look at the price. Work through the business and the balance sheet first, write down a range, then check the quote. Seeing the price first makes it the anchor.
Re-underwrite every holding on a schedule. Once a quarter, treat each position as a new idea. A dated investment thesis helps, because it records the original reasons and dates so you can see which have failed.
Use ranges, not points. A single number invites anchoring. A base and worst case, as in our guide to building a base and worst case, keeps the downside in view.
Separate the tax question. Decide whether you want to own the stock at today's price. Then, separately, decide whether the tax position changes the timing.
Run a pre-mortem. Imagine the position has lost half its value and write the reasons. A pre-mortem brings out the risks an anchor tends to hide.
Put the checks in writing. A short investment checklist with a line such as "estimate written before price checked" turns a good intention into a habit.
Where this goes wrong
Overcorrecting. Some reference points carry information. A recent cash offer from a credible buyer, a rights offering price or a company's own buyback price can say something real about value. The goal is to test anchors, not to ignore every past number.
Swapping one anchor for another. Replacing your cost with an analyst's target, or with the current price, changes the anchor without removing it.
Using bias as an excuse. Calling a disagreement "anchoring" does not prove the other side wrong. The test is always the evidence about value.
Ignoring the other biases. Anchoring rarely works alone. Confirmation bias protects the anchored view by filtering evidence, and loss aversion makes selling below cost feel worse than it is.
Common mistakes
- Averaging down to lower the cost basis. Buying more to make the break-even point closer treats the cost as meaningful. Buy more only if value against today's price justifies it.
- Quoting the drawdown as the thesis. "Down 70% from its high" is a description, not a reason.
- Keeping old models alive. Updating a spreadsheet line by line preserves early assumptions. Start a new sheet when the business has changed.
- Letting the first source set the frame. The first article or report you read on a company often supplies the number you then defend. Reading the primary filings first, as our guide to primary and secondary sources recommends, gives you your own starting point.
Tools that help
Most of the defenses are habits, but tools can make them easier. A research platform that shows ten years of margins and returns on one screen makes it harder to anchor on last year's numbers; our list of the best stock research tools for individual investors compares them. Dombey's published research states each thesis with a date and a value range before the catalyst, so the original case can be checked later; see the research archive.
The bottom line
Anchoring bias is the pull of a first number, such as a purchase price, a past high, a bid or your own early estimate, on every judgment that follows. It leads investors to hold losers for a return to break even, to read large declines as discounts and to update valuations too little when the facts change. The defenses are practical: estimate value before seeing the price, re-underwrite holdings from a blank page, and use ranges and base rates. The question for any position is always the same: what is it worth now, against what it trades at now.