

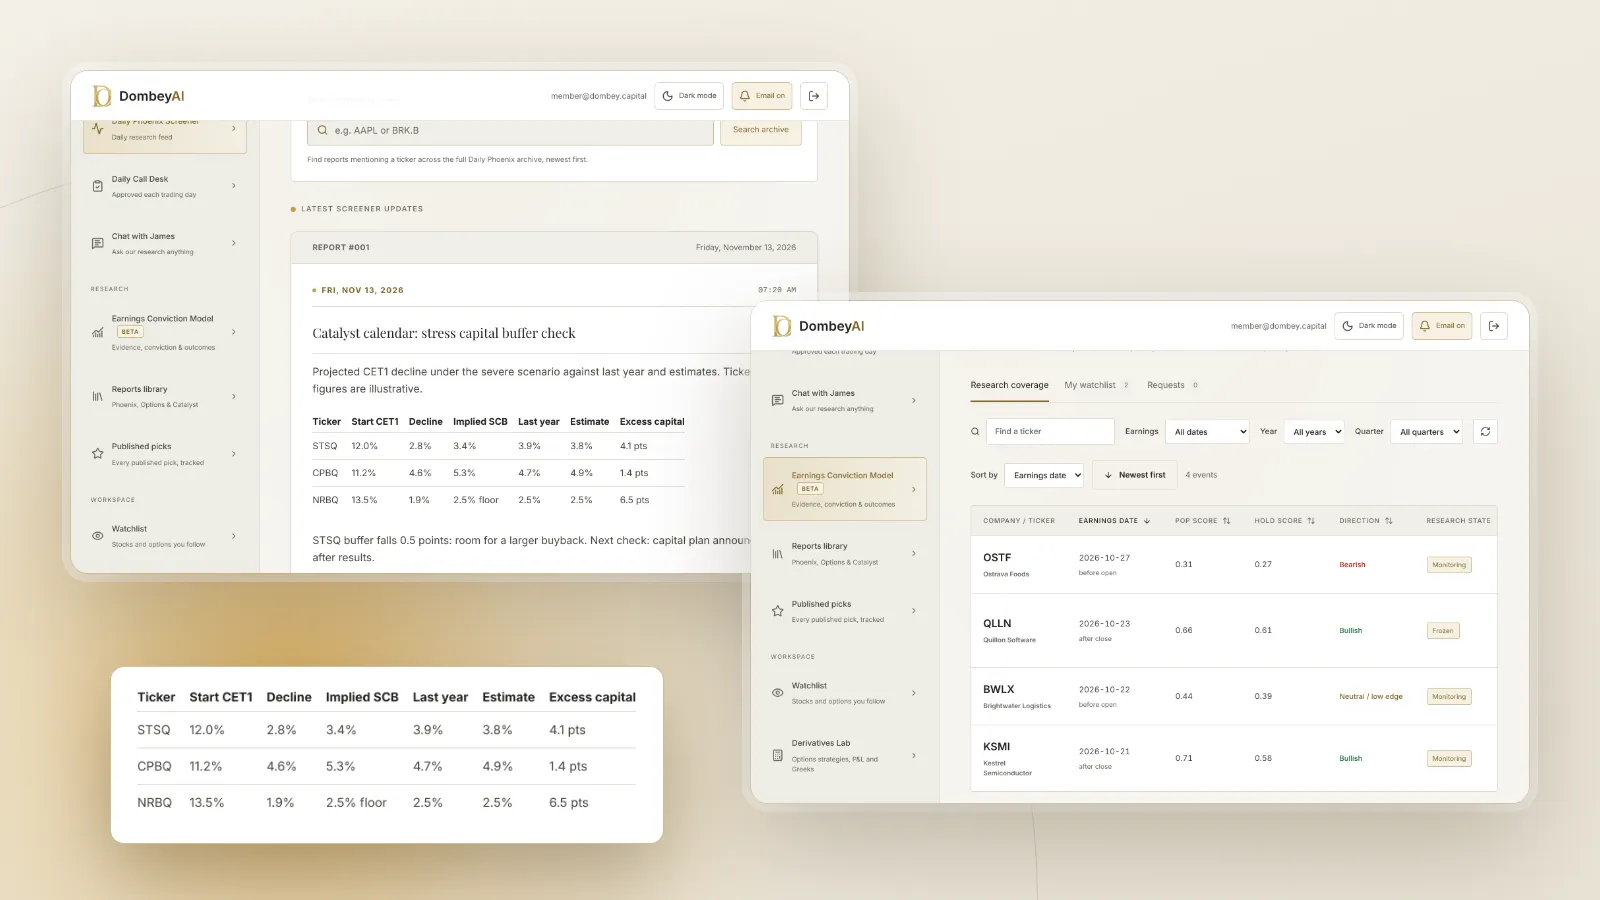
What the stress test is
The Federal Reserve's supervisory stress test projects what would happen to large banks' losses, revenue and capital over nine quarters under a hypothetical severe recession. The Fed designs the scenarios, runs its own models on each bank's data and publishes the results bank by bank.
It applies to bank holding companies, savings and loan holding companies and the US intermediate holding companies of foreign banks with $100 billion or more in total assets. The largest and most complex firms are tested every year; some smaller firms within that group are tested every other year.
The severely adverse scenario typically includes a deep recession, a sharp rise in unemployment, large declines in house prices and commercial real estate values, and a fall in stock prices. Banks with large trading operations also face a global market shock, and the largest also face a counterparty default scenario.
How the results become a capital requirement
Since 2020, the stress test feeds directly into each bank's capital requirement through the stress capital buffer (SCB):
- The Fed projects the bank's common equity tier 1 (CET1) capital ratio over the scenario.
- The largest projected decline from the starting ratio to the lowest point, plus four quarters of planned common dividends as a share of risk-weighted assets, gives the SCB.
- The SCB has a floor of 2.5%.
- The bank's required CET1 ratio is the 4.5% minimum, plus the SCB, plus any surcharge for the largest global banks.
The new buffer usually takes effect on October 1. A bank whose capital falls into its buffer faces automatic limits on dividends, buybacks and discretionary bonuses.
| Input | What it means | Why the market watches it |
|---|---|---|
| Starting CET1 ratio | Capital today as a share of risk-weighted assets | Higher starting capital leaves more cushion |
| Projected minimum CET1 ratio | Lowest point under the severe scenario | Sets the size of the decline |
| Peak-to-trough decline | Starting ratio minus the minimum | The main driver of the SCB |
| Planned dividends | Four quarters of common dividends | Added to the decline |
| Resulting SCB | Decline plus dividends, floor 2.5% | Sets required capital and payout room |
| Excess capital | Actual CET1 minus required CET1 | Room for buybacks and dividend increases |
Why bank stocks move on the results
The stock reaction almost always comes back to capital return. A bank that holds capital well above its requirement can return the excess through dividends and buybacks. The stress test changes the requirement, and so changes the excess.
Three things drive the move:
- The decline against expectations. Analysts estimate each bank's capital decline before the release. A smaller decline than expected implies a lower SCB and more excess capital.
- The decline against last year. A bank whose buffer rises from one year to the next has less room than it did. Changes in the scenario, the bank's balance sheet or the Fed's models can all shift it.
- The capital plan that follows. Banks usually announce dividend increases and buyback authorizations shortly after the results. That announcement, not the results themselves, is often the larger move. Our piece on buybacks as catalysts and our explainer on dividend initiations cover how markets read payout changes.
A timeline of a stress test year
| Period | Event | What to check |
|---|---|---|
| Early in the year | Fed publishes scenarios | Severity of unemployment, real estate and market shocks against last year |
| Spring | Banks submit capital plans | Nothing public yet; watch management commentary on capital |
| Late June (typical) | Fed publishes bank-level results | Each bank's projected decline and implied SCB against estimates |
| Days after results | Banks announce dividends and buybacks | Size of dividend increases, new buyback authorizations |
| Summer | Fed confirms final SCBs | Any change from the preliminary figures |
| October 1 (typical) | New SCB takes effect | Required capital for the next year |
Investors who follow bank events build this into their catalyst calendar. The release date is announced in advance, so it is a hard, dated event rather than a soft one. Our explainer on hard and soft catalysts explains why that distinction matters.
What the results say about a bank
The bank-level disclosures are detailed. Beyond the capital ratios, they include projected loan losses by category, pre-provision net revenue and trading losses. These show where each bank's risk sits:
- Loan loss rates by category. High projected losses on credit cards, commercial real estate or commercial loans point to concentrations.
- Pre-provision net revenue. A bank with strong earnings power absorbs losses better. Low projected revenue can mean a weak business mix.
- Trading and counterparty losses. Large for banks with big markets businesses, and often a large part of their decline.
These figures are useful alongside the bank's own filings. Our guide to valuing a bank stock covers the ratios and disclosures that matter in a full analysis, including tangible book value and return on tangible equity.
Where this goes wrong
- Treating the test as a forecast. The scenario is one hypothetical path. A bank can do well in the test and still have problems the scenario does not capture, such as a deposit run or interest rate risk on securities.
- Ignoring rule changes. The Fed changes scenario design, models and the capital framework over time, and has proposed changes such as averaging results over two years and publishing models for public comment. A year-over-year change in a bank's buffer can reflect the rules rather than the bank. Check the Fed's stress test page for the current approach.
- Reading the headline instead of the bank. Aggregate results across all banks say little about any one stock.
- Missing the capital plan. The announced dividends and buybacks often matter more than the test results, and they can disappoint even after good results.
- Forgetting banks outside the test. Most US banks are below $100 billion in assets and do not take the test. Their stocks can still react to the results through sector sentiment, but their capital is set by other rules. Our piece on what happens to bank stock when a bank fails covers the risks that matter most for smaller lenders.
Common mistakes
- Expecting a pass or fail. Since 2020 the test sets a requirement, so the useful number is the buffer, not a verdict.
- Comparing banks of different categories directly. Global systemically important banks carry surcharges that others do not.
- Ignoring the starting point. A bank with a large projected decline but high starting capital can still have plenty of excess.
- Overlooking buyback execution. An authorization announced after the test is permission, not a promise. The quarterly filings show what was bought.
The bottom line
The Fed stress test projects large banks' capital under a severe hypothetical recession and sets each bank's stress capital buffer. Bank stocks move on the results because that buffer decides how much capital is left over for dividends and buybacks. The numbers to watch are each bank's projected decline against expectations and last year, and the capital plans that follow. Dated bank moves and what drove them are covered on Dombey's market pages. Treat the test as a measure of capital room, not a forecast of how a bank will fare in a real downturn.