

A short definition
Beta compares two sets of returns over the same period: the stock's and a market index's, usually the S&P 500 in the US. It is the slope of a line fitted through those returns. If the market rose 1% in a week and the stock tended to rise 1.3%, and the pattern held on the way down, the stock's beta would be about 1.3.
The formula is:
Beta = covariance (stock returns, market returns) / variance (market returns)
Two things are measured at once. Correlation captures how closely the stock moves with the market. Relative volatility captures how large its moves are compared with the market's. A stock can have a low beta because it barely moves, or because it moves a lot but mostly for its own reasons.
Real examples
The ideas behind beta come from a short run of academic work, and the debate about it is still open.
| Year | Work | What it showed |
|---|---|---|
| 1964 | William Sharpe, capital asset pricing model | Expected return depends on beta alone: risk that can be diversified away earns no reward |
| 1971 | Marshall Blume, on the assessment of risk | Betas drift toward 1.0 over time, the basis for adjusted beta |
| 1972 | Black, Jensen and Scholes | The line linking beta and return was flatter than CAPM predicted |
| 1992 | Fama and French, the cross-section of expected stock returns | Once size and book-to-market were included, beta explained little of the differences in returns |
| 2014 | Frazzini and Pedersen, betting against beta | Low-beta stocks had higher risk-adjusted returns than CAPM implies, across many markets |
For practitioners, the result is a paradox. Beta is still the standard input for the cost of equity in valuation models, even though the evidence that it explains returns is weak.
How to read a beta
| Beta | What it suggests | Typical kinds of business |
|---|---|---|
| Above 1.5 | Moves much more than the market | Early-stage growth, highly levered firms, cyclical industrials |
| 1.0 to 1.5 | Somewhat more than the market | Many technology and consumer discretionary firms |
| About 1.0 | In line with the market | A broad index fund, by construction |
| 0.5 to 1.0 | Less than the market | Consumer staples, health care, utilities |
| Near 0 | Little market link | Cash, short-term Treasury bills, some special situations |
| Below 0 | Tends to move against the market | Rare; some hedges and gold-linked assets in some periods |
These ranges are typical, not rules. Any single stock can sit far outside its group, especially when its business or balance sheet has changed.
Where beta is used
Cost of equity. In CAPM, cost of equity = Treasury yield + beta x equity risk premium. With a 4.0% Treasury yield and a 5.0% premium, a beta of 1.2 gives a cost of equity of 10.0%. That figure feeds the weighted average cost of capital and therefore the discount rate in a discounted cash flow model. What is CAPM covers the model itself.
Portfolio exposure. A portfolio's beta is the weighted average of its holdings' betas. Investors use it to estimate how much a portfolio might move if the market fell and to size index hedges.
Peer comparison. Because a stock's own beta is noisy, analysts often use the average of an industry's betas instead, adjusted for each company's debt. The industry beta tables published by NYU's Aswath Damodaran, listed in the sources, are a common starting point.
Why the same stock shows different betas
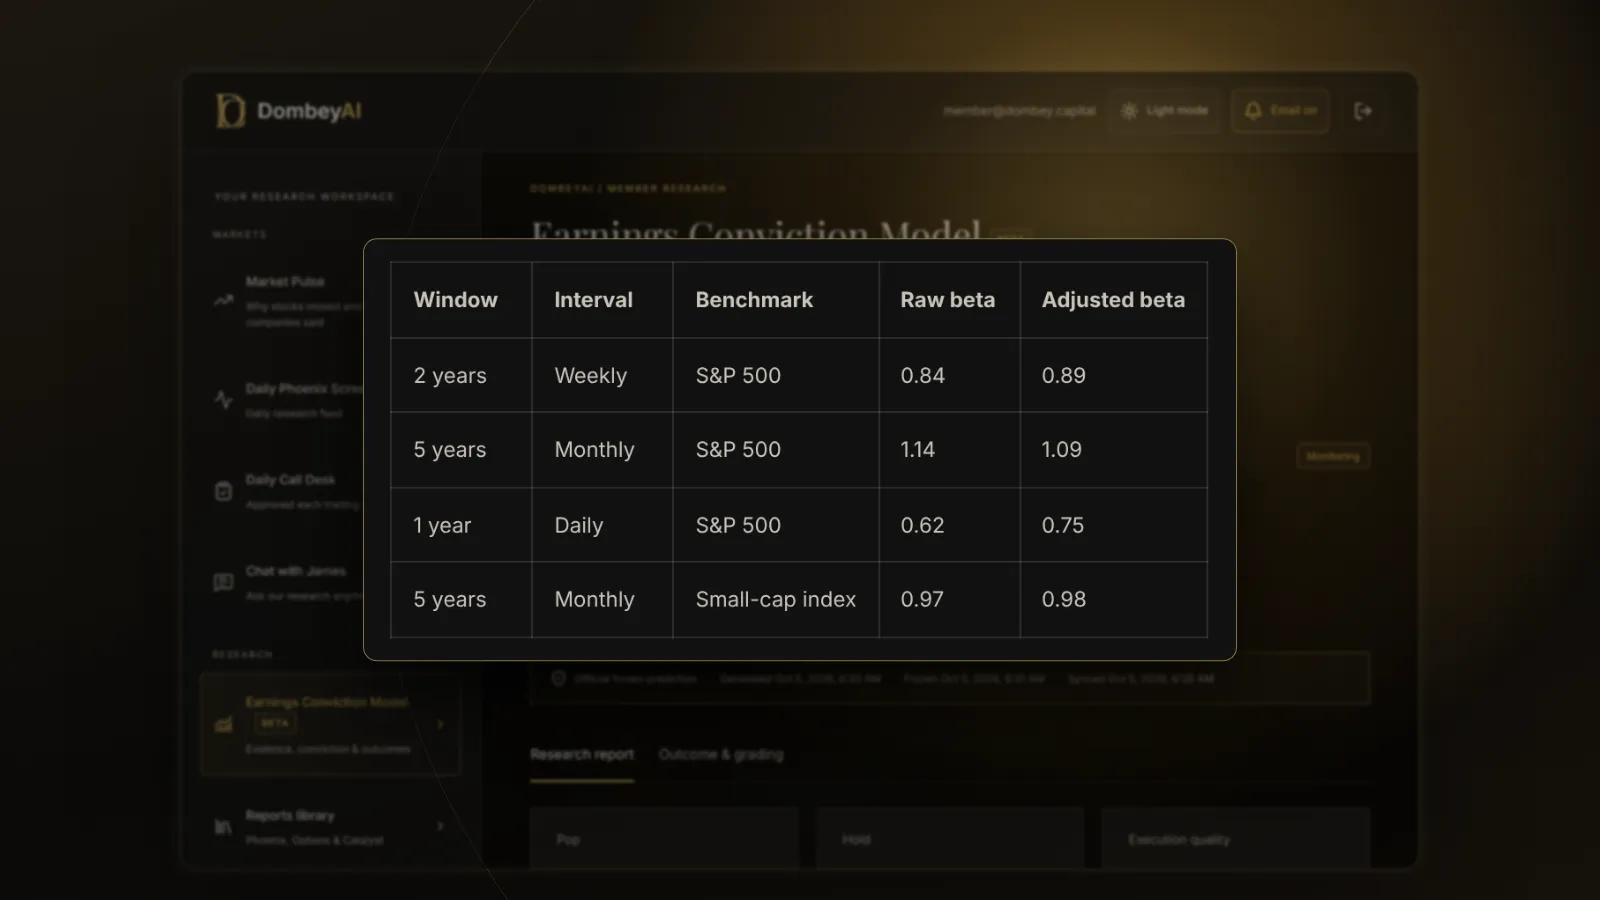
Beta depends on choices that are rarely shown next to the number:
- Period. Two years of weekly returns and five years of monthly returns can give very different answers, especially if the business changed in between.
- Interval. Daily returns understate beta for thinly traded stocks, because their prices react to market moves with a lag.
- Benchmark. A stock measured against the S&P 500, the Russell 2000 or a world index will show different betas.
- Adjustment. Some sources report raw beta; others apply an adjustment toward 1.0, often two-thirds raw plus one-third 1.0.
Always check how a beta was calculated before putting it into a model, and test how sensitive the valuation is to a range of betas.
What beta misses in special situations
Beta measures only the part of a stock's movement that is linked to the market. In event-driven investing, most of the risk is the other part.
A merger arbitrage target trading near its deal price can show a beta close to zero. That does not mean it is safe. Its risk is that the deal breaks, which has little to do with the market on most days. Merger arbitrage explained covers how that risk is priced.
A biotech awaiting a trial readout, a company facing a court ruling, or a stock in Chapter 11 can all have betas that say little about the move that matters. Their outcomes are closer to binary, and beta has no way to see them. Probability-weighted valuation for binary events is the more useful frame. Implied volatility from options often says more about event risk than beta does; see what implied volatility is.
For tools that show beta along with the inputs used to calculate it, see the best stock research tools for individual investors. Dombey's published research treats event risk separately from market risk in each valuation; see the research archive.
Where this goes wrong
- Treating beta as total risk. A low-beta stock can still lose most of its value on company-specific news. Beta ignores the risk that diversification is meant to remove, which for a concentrated portfolio is often the main risk.
- Using a stale beta after a change. A spin-off, a large acquisition or a new capital structure changes the risk of the business. A beta measured on the old company describes something that no longer exists.
- Trusting a beta on thin trading. Illiquid and small stocks often show low betas because their prices update slowly, not because they are less risky.
- Precision that is not there. A beta of 1.17 is an estimate with a wide error band. Small changes in beta can move a DCF value a lot, so a range is more honest than a point.
- Confusing beta with value. Beta says how a stock moved, not what it is worth. A cheap stock and an expensive one can have the same beta.
The bottom line
Beta measures how much a stock has moved with the market, and it is the standard risk input to CAPM and the discount rate in a DCF. It is easy to calculate but sensitive to the period, the interval and the index, so the same stock can show several betas. The evidence that beta explains returns is weak. For special situations, where the risk is a dated event rather than the market, treat beta as a minor input and model the event directly.