

A short definition
The formula is:
Cost of equity = Riskless rate + Beta x (Expected market return - Riskless rate)
The term in brackets is the equity risk premium (ERP), the extra return investors demand for holding stocks over a riskless government bond. Beta scales that premium to the individual stock: a beta of 1.0 means the stock moves in line with the market, above 1.0 means it moves more, and below 1.0 means it moves less.
The idea is that investors are only paid for risk they cannot diversify away. Company-specific risks, such as a failed product or a lawsuit, can be diversified across a portfolio, so CAPM says they carry no extra return. Only sensitivity to the market as a whole, measured by beta, is priced.
Real examples
CAPM has been in use for six decades, and it shows up in places beyond textbooks.
| Where | How CAPM is used | Why it matters |
|---|---|---|
| Academic origin, 1960s | Developed by William Sharpe and others; Sharpe shared the 1990 Nobel Prize in economics with Harry Markowitz and Merton Miller | It became the standard model of risk and return |
| Corporate finance | Companies use it to set a cost of equity and a hurdle rate for projects | Projects that do not earn the hurdle destroy value |
| Utility rate cases | FERC's Opinion No. 569 in 2019 used a CAPM alongside a discounted cash flow model to set allowed returns on equity for electric transmission owners | The allowed return sets what customers pay |
| Equity research | Analysts use it as the discount rate in a DCF and the equity input to WACC | It drives the valuation directly |
| Fama and French, 1992 | Tested whether beta explained the cross-section of US stock returns | Found beta alone explained little, which led to multi-factor models |
The model's reach and its weak empirical record sit side by side. It remains the default because it is simple, transparent and easy to compare across analysts.
How to estimate each input
Riskless rate
Most valuations use the yield on a long-term government bond, often the 10-year US Treasury, published daily by the Treasury. The long bond matches the long life of equity cash flows. Using a 3-month bill instead can change the answer by a point or more when the yield curve is steep or inverted.
Beta
Beta is estimated by regressing the stock's past returns on an index's returns. Choices that change the result:
- Period and frequency. Five years of monthly returns and two years of weekly returns can give very different betas.
- Index. The S&P 500, a broad total market index or a world index each give a different figure.
- Adjustments. Some providers shrink raw betas toward 1.0, on the view that extreme betas tend to drift back.
For companies with short histories, changing businesses or thin trading, analysts often use the average beta of comparable companies, adjusted for each company's debt.
Equity risk premium
The ERP cannot be observed. It is estimated from long historical averages, from surveys of investors and finance professors, or implied from current prices and expected cash flows. Each method gives a different number, and published estimates move over time. State the figure you use and test the result at a point higher and lower.
A worked example
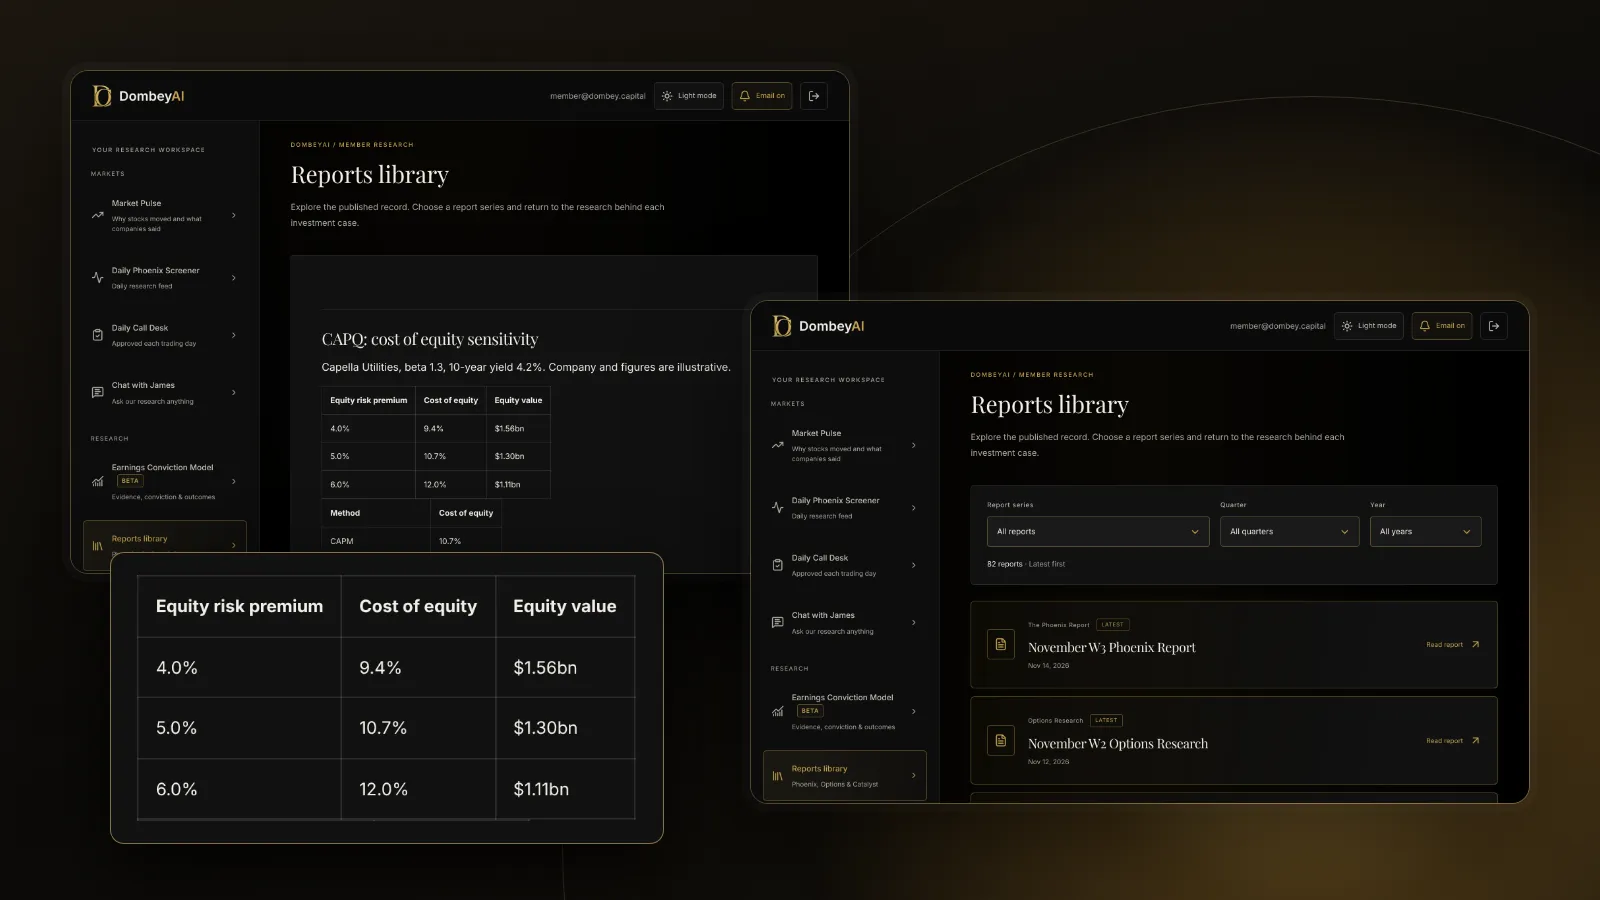
Cost of equity = 4.2% + 1.3 x 5.0% = 10.7%.
Now see how much the inputs matter. Suppose Company A's equity cash flow is $100 million next year, growing 3% a year forever. Using a simple growing perpetuity, value equals cash flow divided by (cost of equity minus growth).
| Equity risk premium | Cost of equity | Value of equity |
|---|---|---|
| 4.0% | 9.4% | $1.56 billion |
| 5.0% | 10.7% | $1.30 billion |
| 6.0% | 12.0% | $1.11 billion |
A two-point range in one unobservable input moves the value by about 40%. That is why the discount rate in a DCF deserves as much scrutiny as the revenue forecast, and why terminal value assumptions amplify it.
CAPM, WACC and the rest of the valuation
CAPM gives the cost of equity only. To value the whole company, you blend it with the after-tax cost of debt, weighted by the capital structure, to get the weighted average cost of capital. That rate discounts free cash flow to the firm. When you value equity directly, as in a comparison of FCFF and FCFE, the CAPM cost of equity is the discount rate itself.
A useful cross-check is to work backward. A reverse DCF asks what growth the current price implies at your cost of equity. If small changes in the rate swing the implied growth wildly, the valuation rests on the discount rate, not the business.
For the tools many investors use to pull betas, yields and comparable-company data, see the best stock research tools for individual investors.
CAPM versus other ways to set a cost of equity
CAPM is the default, but analysts use other methods as checks.
| Method | How it works | Strength | Weakness |
|---|---|---|---|
| CAPM | Riskless rate plus beta times the ERP | Simple, comparable | Rests on beta and an unobservable ERP |
| Build-up method | Riskless rate plus ERP plus a size premium and a company-specific premium | Used for small and private companies | The premiums are judgment calls |
| Multi-factor models | Adds factors such as size and value to market beta | Explains more of past returns | More inputs to estimate |
| Implied cost of equity | Solves for the rate that sets a DCF equal to today's price | Uses market prices directly | Circular if used to value the same stock |
| Bond yield plus premium | Company's own bond yield plus a few points | Reflects the company's credit | The premium is a rule of thumb |
If the methods give answers within a point of each other, the valuation is on firmer ground. If they diverge widely, the cost of equity is uncertain, and the valuation should show that uncertainty rather than hide it in a single rate.
Where this goes wrong
- Beta measured through an event. A stock that sat still awaiting a merger vote, or collapsed on one lawsuit, will show a beta that says little about its future market sensitivity.
- Special situations. For a stock trading below cash or awaiting a court ruling, the main risk is the outcome of a dated event. CAPM, which prices only market risk, can understate it or overstate it.
- False precision. A cost of equity of 10.73% is not more accurate than 10.5% to 11%. Use ranges.
- Mismatched inputs. Mixing a short-term riskless rate with a long-term ERP, or a local index beta with a global ERP, gives an inconsistent rate.
- Ignoring leverage changes. A company that is paying down debt will have a falling equity beta. Past beta reflects the old capital structure.
| Situation | CAPM fit | What to add |
|---|---|---|
| Large, stable, liquid company | Good | Sensitivity table on ERP |
| Small or thinly traded stock | Weak | Comparable-company beta |
| Company changing its debt load | Weak | Re-levered beta |
| Binary event pending | Poor | Scenario values weighted by probability |
The bottom line
CAPM estimates the cost of equity as the riskless rate plus beta times the equity risk premium. It is the standard input for discount rates because it is simple and comparable, not because it predicts returns well. Every input is an estimate, and small changes move valuations a lot, so show a range. For event-driven stocks, pair it with scenario analysis, because the risk that matters is the event, not beta.