

A short definition
Investors can lend to a government at a known yield or own a share of businesses whose returns are uncertain. The equity risk premium is the extra return they demand for choosing the second. It is an expectation about the future, not a fact about the past.
In formula terms:
Equity risk premium = expected return on stocks minus riskless rate
It enters valuation through the capital asset pricing model. The cost of equity is the riskless rate plus beta times the premium. Our explainers on CAPM and beta cover the other two inputs.
Real examples
| Year | Work or estimate | What it showed |
|---|---|---|
| 1976 | Roger Ibbotson and Rex Sinquefield, stocks, bonds, bills and inflation | Long US return histories from 1926 became the standard source for historical premiums |
| 1985 | Rajnish Mehra and Edward Prescott, "The Equity Premium: A Puzzle" | The historical US premium was too large for standard economic models to explain |
| 2002 | Elroy Dimson, Paul Marsh and Mike Staunton, "Triumph of the Optimists" | Long-run premiums across many countries were generally lower than the US figure, which benefited from survivorship |
| 2002 | Eugene Fama and Kenneth French, "The Equity Premium" | Premiums estimated from dividend and earnings growth were well below the realized premium after 1950 |
| Ongoing | Aswath Damodaran, NYU Stern | Publishes an implied premium for the S&P 500 at the start of each month |
| Ongoing | Duke University CFO survey | Asks finance chiefs for their expected market return over the next decade |
| Ongoing | Kroll | Publishes a recommended US premium paired with a normalized riskless rate for valuation practice |
The spread of these results is the point. Serious researchers looking at the same market reach different numbers depending on method.
Three ways to estimate it
Historical premium
The historical method averages the gap between stock returns and government bond or bill returns over a long period. It is simple and grounded in data, but its answer depends on choices:
- Period. Starting in 1926 and starting in 1970 give different answers.
- Benchmark. Using Treasury bills instead of 10-year bonds raises the premium, because bills yield less.
- Averaging. An arithmetic mean of yearly gaps is higher than a geometric, or compounded, mean.
Historical figures also carry wide error bands. Stock returns are volatile, so even a century of data leaves the true premium uncertain by a couple of percentage points.
Implied premium
The implied method asks what premium today's prices assume. Take the index level, an estimate of cash returned to shareholders through dividends and buybacks, and a growth rate. Solve for the discount rate that makes the cash flows worth the index level, then subtract the riskless rate.
The implied method moves with the market. When prices fall and cash flows hold, the premium rises. It is forward-looking, but it depends on the growth assumption, which is itself a judgment. It is the same logic as a reverse DCF, applied to a whole market.
Survey premium
Surveys ask investors, analysts or finance chiefs what they expect. They show what people actually assume, but answers tend to follow recent returns: expectations rise after good years and fall after bad ones.
| Method | Strength | Weakness |
|---|---|---|
| Historical | Real data, easy to reproduce | Backward-looking, sensitive to period and averaging |
| Implied | Forward-looking, updates with prices | Depends on a growth assumption |
| Survey | Shows what decision-makers assume | Follows recent performance, small samples |
How the premium moves a valuation
The premium feeds the cost of equity, which feeds the weighted average cost of capital, which discounts the cash flows in a discounted cash flow model. Small changes compound.
Take Company A with a beta of 1.0 and a riskless rate of 4%. At a 4% premium, its cost of equity is 8%. At a 6% premium, it is 10%. For a company whose free cash flow grows 3% a year forever, the value per dollar of next year's cash flow is 1 divided by the cost of equity minus growth: 20 times at 8%, and about 14.3 times at 10%. A two-point change in the premium cuts the value by nearly 30%. The figures are illustrative.
The effect is largest for long-duration companies, where most of the value sits in the terminal value. It is smallest for businesses whose value arrives soon, such as a liquidation or a cash-rich company with a dated payout.
Country, size and other adjustments
The market premium is a starting point, and analysts often add to it.
Country risk. A company that earns most of its revenue in a market with weaker legal protections or a history of default is riskier than the same business in the US. Practitioners add a country risk premium, often estimated from the spread on that country's government bonds over US Treasuries, scaled for how much more volatile its stocks are than its bonds.
Size. Some valuation practitioners add a premium for small companies, based on historical returns for the smallest stocks. The evidence for it has weakened since it was first published, and it varies by period, so treat it with care.
Company-specific risk. Appraisers sometimes add a further premium for risks such as customer concentration or a single product. This is a judgment call and often the least defensible part of a discount rate.
Each addition should rest on a reason you can state. Stacking premiums without one can push the cost of equity to a level that makes any business look expensive, which is the same error in the other direction.
Using it in practice
- Pick one method and stick with it across companies, so differences reflect the businesses rather than your inputs.
- Match the riskless rate to the premium. A premium measured against 10-year bonds should be paired with a 10-year yield.
- State the number. A valuation that hides its premium hides one of its largest assumptions.
- Cross-check with simple yields. The earnings yield on an index, set against real bond yields, gives a rough sense of whether the implied premium is high or low.
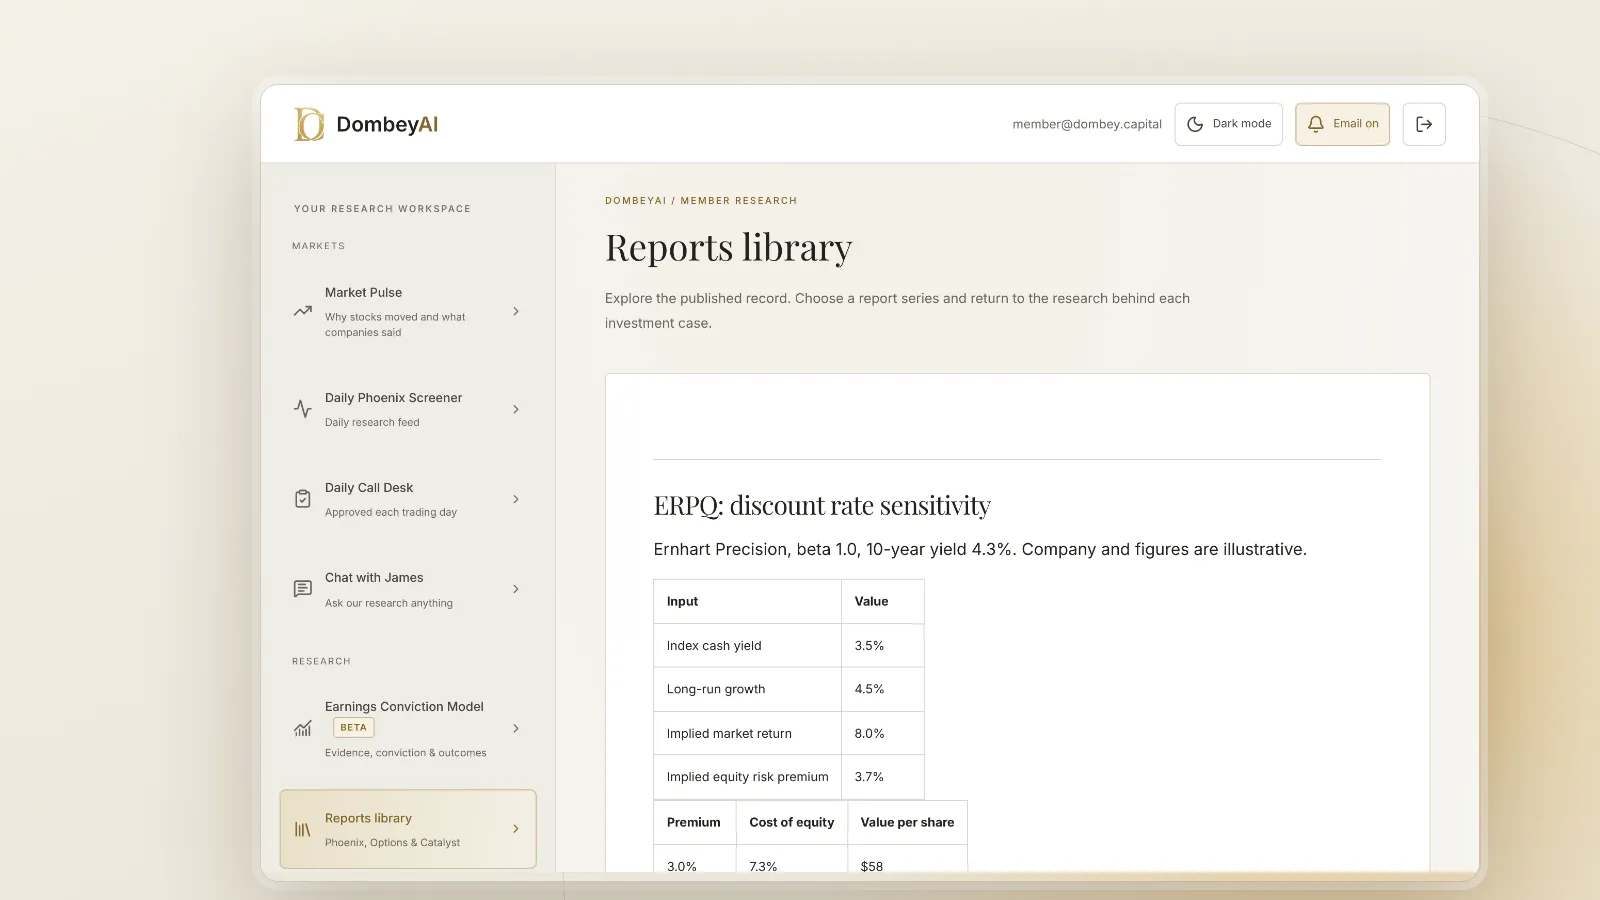
- Run a sensitivity table. Show the value at premiums one point above and below your base case.
If you compare tools that publish discount rates and valuation models, our list of the best stock research tools for individual investors covers the main options.
Where this goes wrong
Mixing inputs. Pairing a historical premium measured against bills with a 10-year bond yield, or an arithmetic premium with a long-horizon model, misstates the cost of equity.
False precision. Quoting the premium to two decimals implies knowledge nobody has. The range of credible estimates is wide.
Ignoring the market's current level. A historical premium applied during a period of high valuations can produce a discount rate the market is not using, so every stock looks expensive or cheap for the wrong reason.
Overusing it for event-driven stocks. For a merger spread, a tender offer or a liquidation, the outcome of a dated event drives the return far more than the market premium does. A precise premium does not fix a wrong view of the event.
The bottom line
The equity risk premium is the extra return investors expect for owning stocks instead of a riskless bond. It is estimated from history, from current prices or from surveys, and each method gives a different answer. Because it sets the cost of equity, it can swing a valuation by a large margin. Choose a method, match it with the right riskless rate, and show the sensitivity rather than defending a single number.