

The two formulas
Current ratio = current assets / current liabilities
Quick ratio = (cash + short-term investments + accounts receivable) / current liabilities
Current assets are expected to become cash within a year or one operating cycle. Current liabilities are due within a year: payables, accrued expenses, short-term debt and the current portion of long-term debt. Both totals appear on the balance sheet, described in how to read a balance sheet.
Some analysts calculate the quick ratio as current assets minus inventory and prepaid expenses. The result is usually close, but the two methods differ when a company has other current assets such as assets held for sale or tax receivables. State which method you use.
Side by side
| Feature | Current ratio | Quick ratio |
|---|---|---|
| Numerator | All current assets | Cash, short-term investments, receivables |
| Includes inventory | Yes | No |
| Includes prepaid expenses | Yes | No |
| Strictness | Looser | Stricter |
| Best for | Overall short-term cushion | Cash available without selling goods |
| Common reference point | 1.0 to 2.0, varies by industry | 1.0, varies by industry |
| Main blind spot | Slow or obsolete inventory | Doubtful receivables |
The gap between the two ratios is mostly inventory. A company with a current ratio of 2.0 and a quick ratio of 0.6 depends heavily on selling its stock of goods to pay its bills.
A worked example
| Line item | Company A | Company B |
|---|---|---|
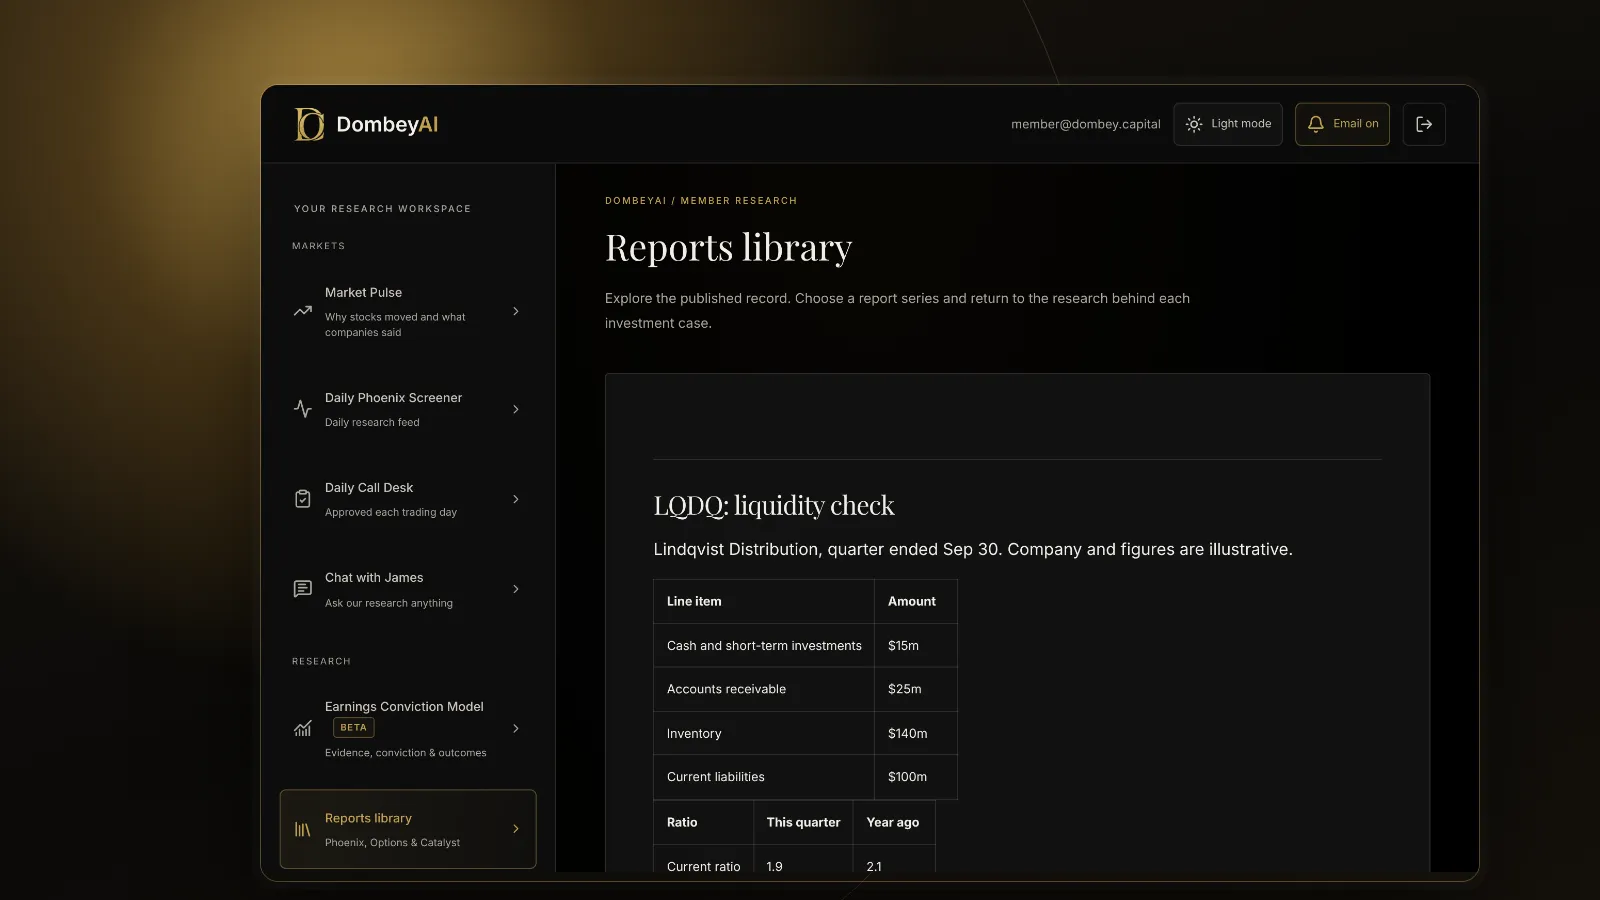
| Cash and short-term investments | $60m | $15m |
| Accounts receivable | $50m | $25m |
| Inventory | $30m | $140m |
| Prepaid expenses | $10m | $10m |
| Current assets | $150m | $190m |
| Current ratio | 1.5 | 1.9 |
| Quick ratio | 1.1 | 0.4 |
Company B looks stronger on the current ratio. On the quick ratio, it is much weaker. Its cushion is almost all inventory. If demand slows or the inventory becomes obsolete, Company B has $40 million of liquid assets against $100 million of bills.
Company A can pay its current liabilities from cash and receivables alone. That matters most when credit tightens or a lender will not extend a facility.
Why industry matters
There is no universal good number. The right level depends on how fast a business turns inventory and receivables into cash and how quickly it pays suppliers.
- Grocers and restaurants collect cash at the register and pay suppliers later. They often run current ratios below 1.0 with no stress.
- Software companies carry little inventory, so their current and quick ratios are close. Large deferred revenue balances can push the current ratio down, because deferred revenue is a current liability that will be settled with service, not cash.
- Manufacturers and distributors carry large inventories. Their quick ratios are often well below their current ratios.
- Banks and insurers do not report a classified balance sheet in the usual way, so these ratios do not apply.
Compare a company with its peers and with its own history. A falling trend is more informative than a single reading.
Related liquidity measures
The current and quick ratios are two of several measures of short-term liquidity. The others answer slightly different questions.
| Measure | Formula | What it adds |
|---|---|---|
| Cash ratio | (Cash + short-term investments) / current liabilities | The strictest test: ignores receivables too |
| Operating cash flow ratio | Cash from operations / current liabilities | Uses a flow over the year instead of a balance on one date |
| Cash conversion cycle | Days inventory + days receivables - days payables | How long cash is tied up in operations |
| Days of cash on hand | Cash / (annual operating expenses / 365) | How many days the company could run on its cash |
The cash ratio matters when receivables are doubtful, for example when one customer is in financial trouble. The operating cash flow ratio matters when the balance sheet date is unusual. The cash conversion cycle explains why two companies with the same current ratio can feel very different: one turns inventory into cash in 30 days, the other in 120.
Using these together gives a fuller picture than any one ratio. A company can pass the current ratio test, fail the cash ratio test and still be healthy if its operating cash flow covers its liabilities comfortably. The reverse is a warning: a decent current ratio with negative operating cash flow means the cushion is being spent.
How the ratios connect to working capital
Current assets minus current liabilities is working capital. The current ratio is the same comparison as a ratio. Working capital for equity investors explains why a change in working capital moves cash flow, and why a company that grows quickly can consume cash even while profitable.
The ratios are snapshots on one date. Companies can move them at quarter end by delaying payments to suppliers or drawing on a revolver just before the balance sheet date. Check the cash flow statement for the period, which shows whether operations generated or used cash.
Using the ratios in special situations
For a cheap stock, liquidity decides whether the company survives long enough for its catalyst. A company trading near net cash per share is only cheap if the cash is real and not needed to cover near-term bills.
Use the ratios as a first screen, then check:
- Debt due within a year. The current portion of long-term debt sits in current liabilities. A maturity can push the current ratio below 1.0 overnight. Refinancing risk and maturity walls covers what follows.
- Receivables quality. Read the allowance for doubtful accounts and any concentration with one customer.
- Inventory reserves. A write-down lowers current assets and suggests the remaining inventory may be overstated too.
- Restricted cash. Cash pledged to lenders or held at a subsidiary may not be available.
- Burn rate. For a loss-making company, quick assets divided by quarterly cash burn gives a rough runway. How to estimate cash runway goes into the method.
Where this goes wrong
- Treating 1.0 as a rule. Many healthy businesses run below it. Many weak ones run above it with uncollectable receivables.
- Ignoring timing. A liability due in 11 months and one due tomorrow both count as current. The ratio does not show when cash is needed.
- Missing off-balance-sheet items. Purchase commitments, guarantees and some leases may not appear in current liabilities.
- Trusting book values. Inventory and receivables are recorded at cost or estimated collectable amounts. In a downturn, both can be worth less.
- Using a single date. One quarter can be distorted by seasonal inventory build or year-end payment timing.
The ratios are tools for asking better questions about liquidity, and they work best next to the cash flow statement and the debt schedule. The guide to stock research tools for individual investors compares platforms that show these ratios over many periods.
The bottom line
The current ratio measures the full short-term cushion, and the quick ratio measures the part that does not depend on selling inventory. The gap between them shows how much of a company's liquidity rests on its inventory. Neither has a universal threshold, so compare with peers and the company's own trend. For cheap stocks and special situations, use both as a starting screen, then read the notes on debt, receivables and inventory before trusting the number.