

The definitions
EBIT = net income + interest expense + income tax expense
EBITDA = EBIT + depreciation + amortization
You can also build EBIT from the top: revenue minus cost of goods sold minus operating expenses, which gives operating income. For most companies, EBIT and operating income are close. They differ when a company has non-operating gains, losses or investment income that analysts treat differently.
Depreciation spreads the cost of physical assets, such as machinery and buildings, over their useful lives. Amortization does the same for intangible assets, such as acquired customer lists and patents. Both are non-cash charges in the period they are recorded, but they reflect cash that was spent earlier.
Side by side
| Feature | EBIT | EBITDA |
|---|---|---|
| Starts from | Net income or operating income | EBIT |
| Removes | Interest and taxes | Interest, taxes, depreciation and amortization |
| Reflects asset wear | Yes, through depreciation | No |
| Best for | Capital-heavy businesses, owner earnings | Comparing across accounting and financing choices, debt covenants |
| Common multiple | EV/EBIT | EV/EBITDA |
| Main blind spot | Different depreciation policies across companies | Ignores the cost of replacing assets |
| GAAP measure | No | No |
Both are non-GAAP. When a US public company reports either, it must reconcile the figure to the closest GAAP measure, a requirement that dates from the SEC's 2003 non-GAAP rules.
A worked example
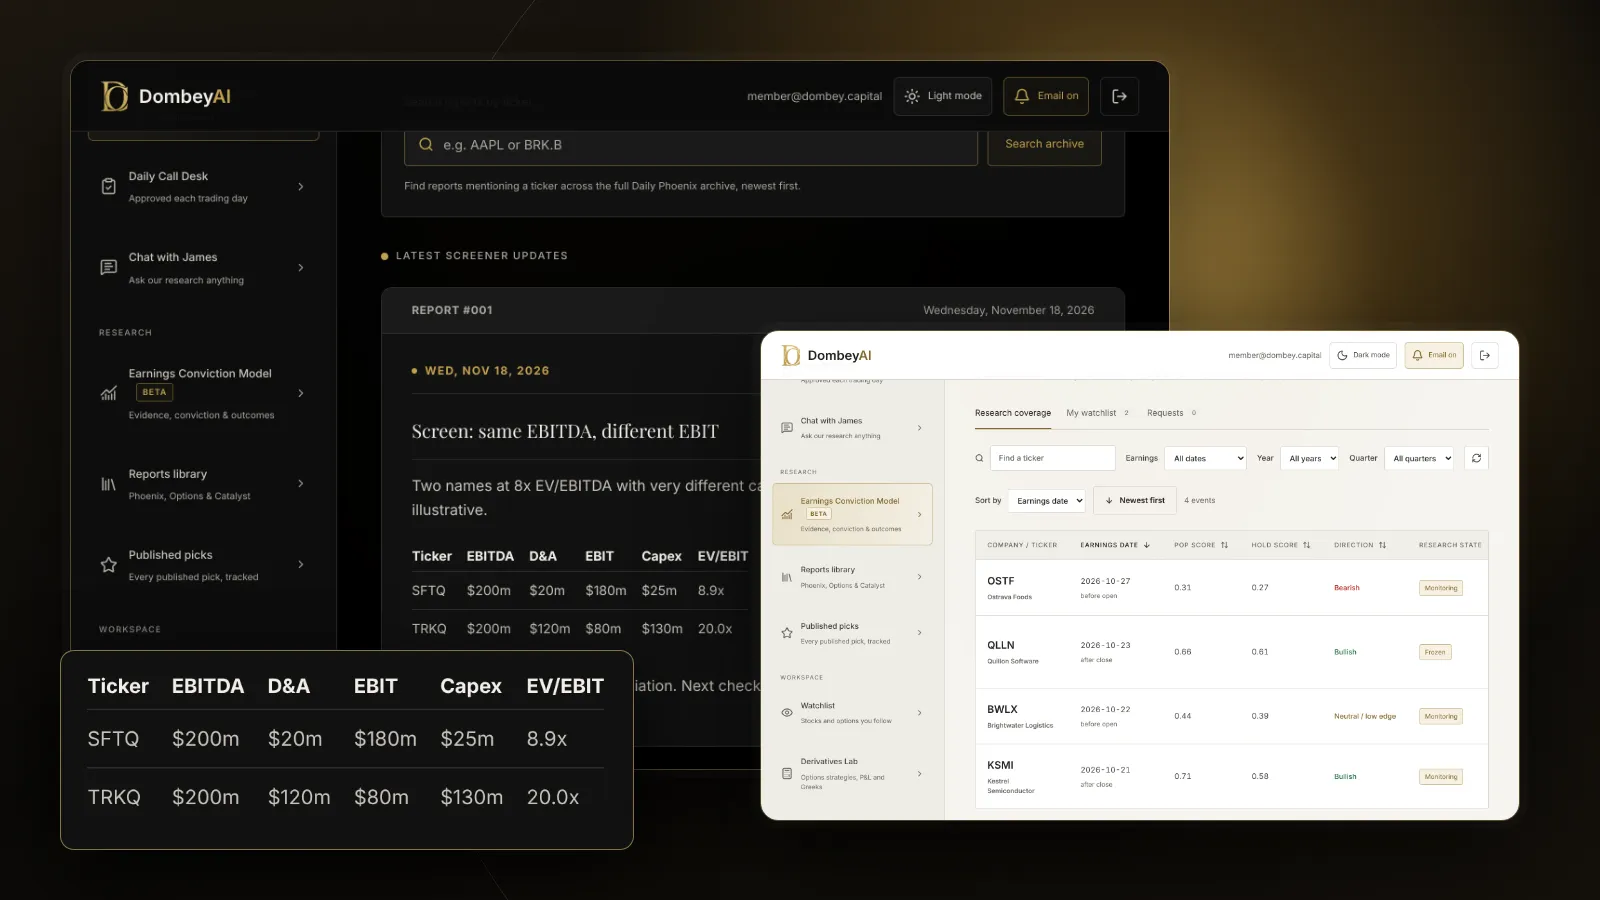
| Line | Company A (software) | Company B (trucking) |
|---|---|---|
| EBITDA | $200m | $200m |
| Depreciation and amortization | $20m | $120m |
| EBIT | $180m | $80m |
| Capital expenditure | $25m | $130m |
| EBITDA minus capex | $175m | $70m |
On EBITDA, the two companies look identical. On EBIT, Company A earns more than twice as much. Company B has to replace its trucks every few years, and its capital spending is higher than its depreciation. EBITDA treats that cost as if it did not exist.
If both companies traded at an enterprise value of $1,600 million, the EV/EBITDA multiple would be 8x for both. EV/EBIT would be about 8.9x for Company A and 20x for Company B. The second figure tells you much more about what an owner earns. EV/EBITDA uses and blind spots covers the multiple in more detail.
When EBITDA fits
EBITDA earns its place in a few situations.
- Comparing across capital structures. It removes interest, so a company funded by debt and one funded by equity can be compared on operating results.
- Comparing across asset ages. A company with old, fully depreciated equipment and one with new equipment can look very different on EBIT. EBITDA reduces that distortion.
- Leveraged buyouts and lending. Lenders size debt as a multiple of EBITDA and set covenants on it. Net debt to EBITDA is the standard leverage ratio.
- Acquisition-heavy companies. Amortization of acquired intangibles can be large and does not reflect a cost of running the business. Adding it back can make results comparable to companies that grew internally.
When EBIT fits
EBIT is the better measure in other situations.
- Capital-intensive businesses. Airlines, manufacturers, telecoms and trucking companies have to keep spending to stay in business. Depreciation is the closest income-statement stand-in for that spending.
- Estimating owner earnings. What a business can return to owners is closer to EBIT minus taxes, adjusted for any gap between capex and depreciation. Owner earnings develops that idea.
- Interest coverage. The interest coverage ratio is usually EBIT divided by interest expense, because interest has to be paid after the cost of maintaining assets.
- Return on capital. ROIC uses after-tax EBIT as its profit measure.
How to calculate both from a 10-K
The figures come from two statements, and the method is the same for any company.
| Step | Where to find it | What to note |
|---|---|---|
| 1. Start with operating income | Income statement | Check whether it includes unusual gains or losses |
| 2. Add or remove non-operating items | Income statement, other income line | Decide which belong in EBIT |
| 3. Find depreciation and amortization | Cash flow statement, first section | The income statement often buries D&A inside cost lines |
| 4. Add D&A to EBIT | Your calculation | This is EBITDA |
| 5. Compare with capital expenditure | Cash flow statement, investing section | Capex far above D&A means EBITDA flatters the business |
| 6. Compare with the company's own figure | Earnings release reconciliation | Note every difference and why |
The cash flow statement is the reliable source for depreciation and amortization, because many income statements spread those charges across cost of sales and operating expenses. How to read a cash flow statement explains where to look.
Splitting depreciation from amortization is worth the extra minute. Depreciation usually reflects assets that must be replaced. Amortization of acquired intangibles often does not, because the customer list or brand does not need to be bought again. Some analysts therefore use a measure between the two: EBIT plus amortization of acquired intangibles, sometimes called EBITA.
Adjusted versions
Many companies report "adjusted EBITDA", which removes further items such as stock-based compensation, restructuring costs and acquisition expenses. Each adjustment can be reasonable or can make results look better than they are. Adjusted EBITDA and the add-backs to question lists the most common ones. Whether stock-based compensation is a real expense covers the most debated add-back.
The same applies to adjusted EBIT, though it is less common. Read the reconciliation table in the earnings release and decide for yourself which items are truly one-time.
Where this goes wrong
- Treating EBITDA as cash flow. EBITDA ignores capital spending, working capital and taxes. A company can report rising EBITDA while burning cash.
- Comparing across industries. An EV/EBITDA of 8x means very different things for a software company and a steel mill.
- Accepting the company's definition. EBITDA is not standardized. One company's figure may include items another excludes.
- Ignoring lease accounting. Under current US GAAP, operating lease costs sit in operating expenses, so EBITDA comparisons between companies that lease and companies that own assets can mislead. Under IFRS, most lease costs move below EBITDA.
- Forgetting depreciation policy. A company that stretches useful lives reports lower depreciation and higher EBIT. Read the property and equipment note.
- Ignoring capitalized costs. Companies that capitalize software development or other spending move it out of operating expenses and into amortization. EBITDA then excludes a cost that recurs every year.
For tools that show EBIT, EBITDA and their reconciliations across many years, the guide to stock research tools for individual investors compares the main platforms.
The bottom line
EBIT is profit before interest and taxes. EBITDA also adds back depreciation and amortization, which makes it useful for comparing companies with different accounting and financing, and for setting debt limits. EBIT is the more honest measure for businesses that must keep spending on assets. Use both, compare the gap between them with capital spending, and always reconcile to the filing before trusting either number.